Chlorobium sp.
Taxonomy: cellular organisms; Bacteria; FCB group; Bacteroidetes/Chlorobi group; Chlorobi; Chlorobia; Chlorobiales; Chlorobiaceae; Chlorobium/Pelodictyon group; Chlorobium; unclassified Chlorobium
Average proteome isoelectric point is 6.64
Get precalculated fractions of proteins
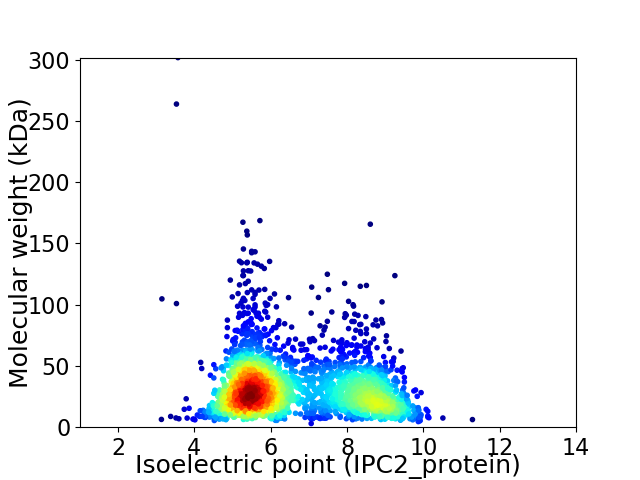
Virtual 2D-PAGE plot for 2365 proteins (isoelectric point calculated using IPC2_protein)
Get csv file with sequences according to given criteria:
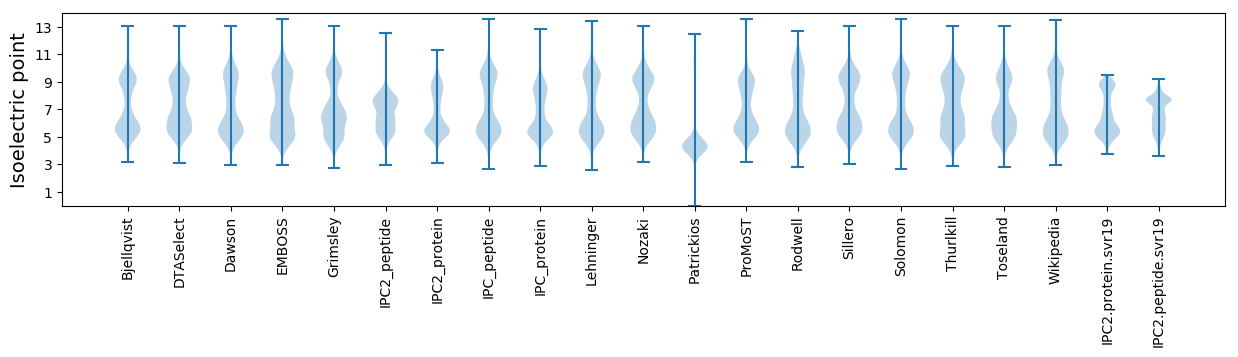
* You can choose from 21 different methods for calculating isoelectric point
Summary statistics related to proteome-wise predictions
Protein with the lowest isoelectric point:
>tr|A0A533TVJ6|A0A533TVJ6_CHLSQ RNA polymerase subunit sigma-24 OS=Chlorobium sp. OX=1095 GN=FDX30_06930 PE=4 SV=1
MM1 pKa = 7.04QKK3 pKa = 9.36WVCVPCGYY11 pKa = 10.9VYY13 pKa = 10.71DD14 pKa = 4.68PEE16 pKa = 5.62VGDD19 pKa = 4.42PDD21 pKa = 4.57SGIDD25 pKa = 3.37PGTPFEE31 pKa = 5.41DD32 pKa = 4.71LPEE35 pKa = 4.74DD36 pKa = 3.78WVCPVCGVDD45 pKa = 3.16KK46 pKa = 10.68TLFEE50 pKa = 5.37PYY52 pKa = 10.27DD53 pKa = 3.66EE54 pKa = 4.39NKK56 pKa = 10.11RR57 pKa = 11.84RR58 pKa = 3.56
MM1 pKa = 7.04QKK3 pKa = 9.36WVCVPCGYY11 pKa = 10.9VYY13 pKa = 10.71DD14 pKa = 4.68PEE16 pKa = 5.62VGDD19 pKa = 4.42PDD21 pKa = 4.57SGIDD25 pKa = 3.37PGTPFEE31 pKa = 5.41DD32 pKa = 4.71LPEE35 pKa = 4.74DD36 pKa = 3.78WVCPVCGVDD45 pKa = 3.16KK46 pKa = 10.68TLFEE50 pKa = 5.37PYY52 pKa = 10.27DD53 pKa = 3.66EE54 pKa = 4.39NKK56 pKa = 10.11RR57 pKa = 11.84RR58 pKa = 3.56
Molecular weight: 6.61 kDa
Isoelectric point according different methods:
Protein with the highest isoelectric point:
>tr|A0A533U647|A0A533U647_CHLSQ Sulfurtransferase complex subunit TusC OS=Chlorobium sp. OX=1095 GN=tusC PE=3 SV=1
MM1 pKa = 7.42KK2 pKa = 9.6RR3 pKa = 11.84TFQPRR8 pKa = 11.84NRR10 pKa = 11.84KK11 pKa = 8.8RR12 pKa = 11.84RR13 pKa = 11.84NKK15 pKa = 9.88HH16 pKa = 4.5GFRR19 pKa = 11.84QRR21 pKa = 11.84MATKK25 pKa = 10.18NGRR28 pKa = 11.84KK29 pKa = 9.24VLSSRR34 pKa = 11.84RR35 pKa = 11.84AKK37 pKa = 10.19GRR39 pKa = 11.84HH40 pKa = 4.95SLSVSSQMGTTGRR53 pKa = 3.74
MM1 pKa = 7.42KK2 pKa = 9.6RR3 pKa = 11.84TFQPRR8 pKa = 11.84NRR10 pKa = 11.84KK11 pKa = 8.8RR12 pKa = 11.84RR13 pKa = 11.84NKK15 pKa = 9.88HH16 pKa = 4.5GFRR19 pKa = 11.84QRR21 pKa = 11.84MATKK25 pKa = 10.18NGRR28 pKa = 11.84KK29 pKa = 9.24VLSSRR34 pKa = 11.84RR35 pKa = 11.84AKK37 pKa = 10.19GRR39 pKa = 11.84HH40 pKa = 4.95SLSVSSQMGTTGRR53 pKa = 3.74
Molecular weight: 6.23 kDa
Isoelectric point according different methods:
Peptides (in silico digests for buttom-up proteomics)
Below you can find in silico digests of the whole proteome with Trypsin, Chymotrypsin, Trypsin+LysC, LysN, ArgC proteases suitable for different mass spec machines.| Try ESI |
 |
|---|
| ChTry ESI |
|
|---|
| ArgC ESI |
|
|---|
| LysN ESI |
|
|---|
| TryLysC ESI |
|
|---|
| Try MALDI |
|
|---|
| ChTry MALDI |
|
|---|
| ArgC MALDI |
|
|---|
| LysN MALDI |
|
|---|
| TryLysC MALDI |
|
|---|
| Try LTQ |
|
|---|
| ChTry LTQ |
|
|---|
| ArgC LTQ |
|
|---|
| LysN LTQ |
|
|---|
| TryLysC LTQ |
|
|---|
| Try MSlow |
|
|---|
| ChTry MSlow |
|
|---|
| ArgC MSlow |
|
|---|
| LysN MSlow |
|
|---|
| TryLysC MSlow |
|
|---|
| Try MShigh |
|
|---|
| ChTry MShigh |
|
|---|
| ArgC MShigh |
|
|---|
| LysN MShigh |
|
|---|
| TryLysC MShigh |
|
|---|
General Statistics
Number of major isoforms |
Number of additional isoforms |
Number of all proteins |
Number of amino acids |
Min. Seq. Length |
Max. Seq. Length |
Avg. Seq. Length |
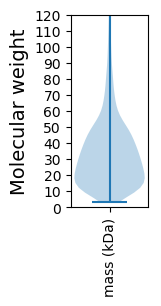
Avg. Mol. Weight |
|---|---|---|---|---|---|---|---|
0 |
745862 |
26 |
2967 |
315.4 |
35.11 |
Amino acid frequency
Ala |
Cys |
Asp |
Glu |
Phe |
Gly |
His |
Ile |
Lys |
Leu |
|---|---|---|---|---|---|---|---|---|---|
8.05 ± 0.054 | 1.167 ± 0.02 |
5.271 ± 0.044 | 6.615 ± 0.059 |
4.566 ± 0.037 | 7.332 ± 0.048 |
2.125 ± 0.022 | 7.068 ± 0.047 |
5.706 ± 0.045 | 9.882 ± 0.058 |
Met |
Asn |
Gln |
Pro |
Arg |
Ser |
Thr |
Val |
Trp |
Tyr |
|---|---|---|---|---|---|---|---|---|---|
2.623 ± 0.022 | 3.968 ± 0.036 |
4.226 ± 0.033 | 3.076 ± 0.024 |
5.499 ± 0.048 | 6.784 ± 0.042 |
5.09 ± 0.04 | 6.768 ± 0.044 |
1.051 ± 0.019 | 3.132 ± 0.029 |
Most of the basic statistics you can see at this page can be downloaded from this CSV file
See this proteome in:

Proteome-pI is available under Creative Commons Attribution-NoDerivs license, for more details see here
| Reference: Kozlowski LP. Proteome-pI 2.0: Proteome Isoelectric Point Database Update. Nucleic Acids Res. 2021, doi: 10.1093/nar/gkab944 | Contact: Lukasz P. Kozlowski |