Euryarchaeota archaeon
Taxonomy: cellular organisms; Archaea; Euryarchaeota; unclassified Euryarchaeota
Average proteome isoelectric point is 7.09
Get precalculated fractions of proteins
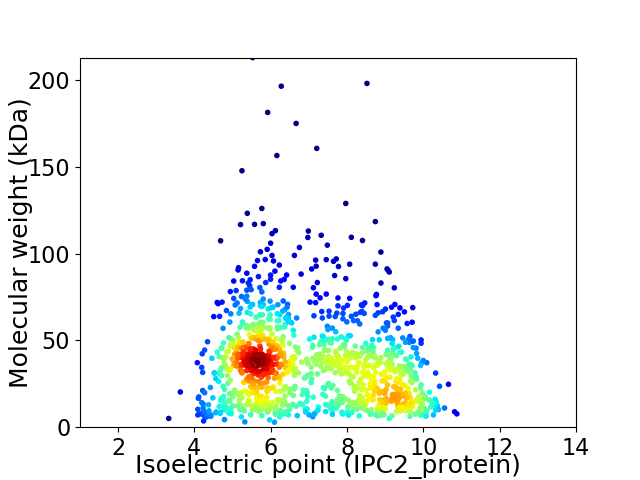
Virtual 2D-PAGE plot for 1149 proteins (isoelectric point calculated using IPC2_protein)
Get csv file with sequences according to given criteria:
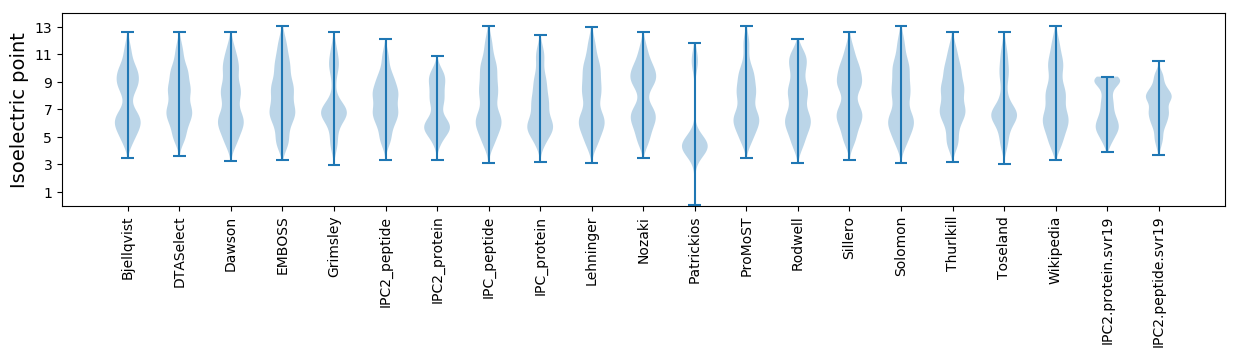
* You can choose from 21 different methods for calculating isoelectric point
Summary statistics related to proteome-wise predictions
Protein with the lowest isoelectric point:
>tr|A0A482RAB5|A0A482RAB5_9EURY Uncharacterized protein OS=Euryarchaeota archaeon OX=2026739 GN=EOO41_01335 PE=4 SV=1
MM1 pKa = 7.32VLLEE5 pKa = 4.42VEE7 pKa = 4.1WKK9 pKa = 9.97VIYY12 pKa = 10.39VGSSRR17 pKa = 11.84DD18 pKa = 3.57PIYY21 pKa = 11.08DD22 pKa = 3.33QVLDD26 pKa = 4.26CFSMGG31 pKa = 3.39
MM1 pKa = 7.32VLLEE5 pKa = 4.42VEE7 pKa = 4.1WKK9 pKa = 9.97VIYY12 pKa = 10.39VGSSRR17 pKa = 11.84DD18 pKa = 3.57PIYY21 pKa = 11.08DD22 pKa = 3.33QVLDD26 pKa = 4.26CFSMGG31 pKa = 3.39
Molecular weight: 3.59 kDa
Isoelectric point according different methods:
Protein with the highest isoelectric point:
>tr|A0A482R8H9|A0A482R8H9_9EURY Uncharacterized protein (Fragment) OS=Euryarchaeota archaeon OX=2026739 GN=EOO41_01380 PE=4 SV=1
MM1 pKa = 7.35HH2 pKa = 7.45CLISVHH8 pKa = 6.64SNTTRR13 pKa = 11.84GVAAGLWPSRR23 pKa = 11.84LRR25 pKa = 11.84ASVRR29 pKa = 11.84RR30 pKa = 11.84RR31 pKa = 11.84HH32 pKa = 4.92TAATGVGSQNTSFFPPSPHH51 pKa = 6.52NNLLHH56 pKa = 6.12TPHH59 pKa = 6.98TAGQAAQNAGSSSMRR74 pKa = 11.84RR75 pKa = 11.84RR76 pKa = 11.84GARR79 pKa = 11.84TFQGG83 pKa = 3.24
MM1 pKa = 7.35HH2 pKa = 7.45CLISVHH8 pKa = 6.64SNTTRR13 pKa = 11.84GVAAGLWPSRR23 pKa = 11.84LRR25 pKa = 11.84ASVRR29 pKa = 11.84RR30 pKa = 11.84RR31 pKa = 11.84HH32 pKa = 4.92TAATGVGSQNTSFFPPSPHH51 pKa = 6.52NNLLHH56 pKa = 6.12TPHH59 pKa = 6.98TAGQAAQNAGSSSMRR74 pKa = 11.84RR75 pKa = 11.84RR76 pKa = 11.84GARR79 pKa = 11.84TFQGG83 pKa = 3.24
Molecular weight: 8.89 kDa
Isoelectric point according different methods:
Peptides (in silico digests for buttom-up proteomics)
Below you can find in silico digests of the whole proteome with Trypsin, Chymotrypsin, Trypsin+LysC, LysN, ArgC proteases suitable for different mass spec machines.| Try ESI |
 |
|---|
| ChTry ESI |
|
|---|
| ArgC ESI |
|
|---|
| LysN ESI |
|
|---|
| TryLysC ESI |
|
|---|
| Try MALDI |
|
|---|
| ChTry MALDI |
|
|---|
| ArgC MALDI |
|
|---|
| LysN MALDI |
|
|---|
| TryLysC MALDI |
|
|---|
| Try LTQ |
|
|---|
| ChTry LTQ |
|
|---|
| ArgC LTQ |
|
|---|
| LysN LTQ |
|
|---|
| TryLysC LTQ |
|
|---|
| Try MSlow |
|
|---|
| ChTry MSlow |
|
|---|
| ArgC MSlow |
|
|---|
| LysN MSlow |
|
|---|
| TryLysC MSlow |
|
|---|
| Try MShigh |
|
|---|
| ChTry MShigh |
|
|---|
| ArgC MShigh |
|
|---|
| LysN MShigh |
|
|---|
| TryLysC MShigh |
|
|---|
General Statistics
Number of major isoforms |
Number of additional isoforms |
Number of all proteins |
Number of amino acids |
Min. Seq. Length |
Max. Seq. Length |
Avg. Seq. Length |
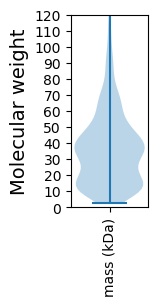
Avg. Mol. Weight |
|---|---|---|---|---|---|---|---|
0 |
416076 |
26 |
2087 |
362.1 |
37.78 |
Amino acid frequency
Ala |
Cys |
Asp |
Glu |
Phe |
Gly |
His |
Ile |
Lys |
Leu |
|---|---|---|---|---|---|---|---|---|---|
17.699 ± 0.097 | 1.915 ± 0.044 |
4.423 ± 0.04 | 4.05 ± 0.06 |
2.094 ± 0.034 | 6.781 ± 0.077 |
3.034 ± 0.034 | 2.175 ± 0.028 |
1.624 ± 0.035 | 9.412 ± 0.084 |
Met |
Asn |
Gln |
Pro |
Arg |
Ser |
Thr |
Val |
Trp |
Tyr |
|---|---|---|---|---|---|---|---|---|---|
2.304 ± 0.027 | 1.726 ± 0.026 |
6.607 ± 0.073 | 3.583 ± 0.048 |
6.936 ± 0.055 | 9.462 ± 0.071 |
6.23 ± 0.047 | 7.418 ± 0.051 |
1.08 ± 0.023 | 1.445 ± 0.025 |
Most of the basic statistics you can see at this page can be downloaded from this CSV file
See this proteome in:

Proteome-pI is available under Creative Commons Attribution-NoDerivs license, for more details see here
| Reference: Kozlowski LP. Proteome-pI 2.0: Proteome Isoelectric Point Database Update. Nucleic Acids Res. 2021, doi: 10.1093/nar/gkab944 | Contact: Lukasz P. Kozlowski |