Mycobacterium phage GS4E
Taxonomy: Viruses; Duplodnaviria; Heunggongvirae; Uroviricota; Caudoviricetes; Caudovirales; Siphoviridae; Fromanvirus; unclassified Fromanvirus
Average proteome isoelectric point is 5.95
Get precalculated fractions of proteins
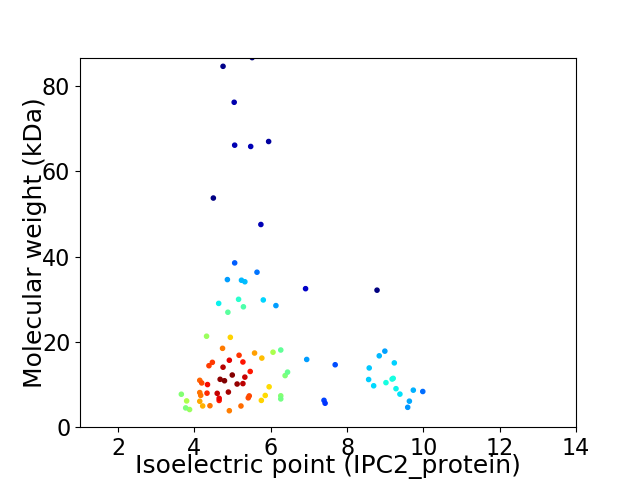
Virtual 2D-PAGE plot for 88 proteins (isoelectric point calculated using IPC2_protein)
Get csv file with sequences according to given criteria:
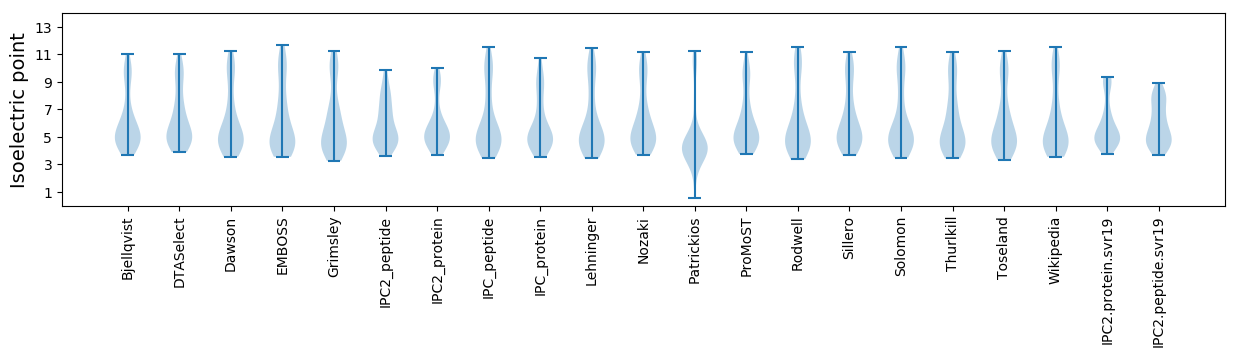
* You can choose from 21 different methods for calculating isoelectric point
Summary statistics related to proteome-wise predictions
Protein with the lowest isoelectric point:
>tr|A0A2Z5XCA8|A0A2Z5XCA8_9CAUD Uncharacterized protein OS=Mycobacterium phage GS4E OX=2072004 PE=4 SV=1
MM1 pKa = 7.44FGDD4 pKa = 5.8RR5 pKa = 11.84YY6 pKa = 10.31IDD8 pKa = 3.45WDD10 pKa = 3.36GHH12 pKa = 4.31EE13 pKa = 4.57QYY15 pKa = 10.88TLFDD19 pKa = 3.84LEE21 pKa = 5.01GIHH24 pKa = 7.51DD25 pKa = 4.32YY26 pKa = 11.04VHH28 pKa = 6.76EE29 pKa = 5.15GDD31 pKa = 5.19DD32 pKa = 3.82EE33 pKa = 4.27EE34 pKa = 4.55
MM1 pKa = 7.44FGDD4 pKa = 5.8RR5 pKa = 11.84YY6 pKa = 10.31IDD8 pKa = 3.45WDD10 pKa = 3.36GHH12 pKa = 4.31EE13 pKa = 4.57QYY15 pKa = 10.88TLFDD19 pKa = 3.84LEE21 pKa = 5.01GIHH24 pKa = 7.51DD25 pKa = 4.32YY26 pKa = 11.04VHH28 pKa = 6.76EE29 pKa = 5.15GDD31 pKa = 5.19DD32 pKa = 3.82EE33 pKa = 4.27EE34 pKa = 4.55
Molecular weight: 4.15 kDa
Isoelectric point according different methods:
Protein with the highest isoelectric point:
>tr|A0A2Z5XCE3|A0A2Z5XCE3_9CAUD Uncharacterized protein OS=Mycobacterium phage GS4E OX=2072004 PE=4 SV=1
MM1 pKa = 7.63TFTKK5 pKa = 10.5LPYY8 pKa = 8.63LHH10 pKa = 7.01KK11 pKa = 10.35NARR14 pKa = 11.84SRR16 pKa = 11.84QITSRR21 pKa = 11.84EE22 pKa = 3.78VRR24 pKa = 11.84EE25 pKa = 3.98VFAAEE30 pKa = 3.86VTRR33 pKa = 11.84NLDD36 pKa = 3.07RR37 pKa = 11.84RR38 pKa = 11.84LDD40 pKa = 3.39KK41 pKa = 11.2DD42 pKa = 3.37EE43 pKa = 3.77YY44 pKa = 10.68LRR46 pKa = 11.84RR47 pKa = 11.84VMPP50 pKa = 4.78
MM1 pKa = 7.63TFTKK5 pKa = 10.5LPYY8 pKa = 8.63LHH10 pKa = 7.01KK11 pKa = 10.35NARR14 pKa = 11.84SRR16 pKa = 11.84QITSRR21 pKa = 11.84EE22 pKa = 3.78VRR24 pKa = 11.84EE25 pKa = 3.98VFAAEE30 pKa = 3.86VTRR33 pKa = 11.84NLDD36 pKa = 3.07RR37 pKa = 11.84RR38 pKa = 11.84LDD40 pKa = 3.39KK41 pKa = 11.2DD42 pKa = 3.37EE43 pKa = 3.77YY44 pKa = 10.68LRR46 pKa = 11.84RR47 pKa = 11.84VMPP50 pKa = 4.78
Molecular weight: 6.11 kDa
Isoelectric point according different methods:
Peptides (in silico digests for buttom-up proteomics)
Below you can find in silico digests of the whole proteome with Trypsin, Chymotrypsin, Trypsin+LysC, LysN, ArgC proteases suitable for different mass spec machines.| Try ESI |
 |
|---|
| ChTry ESI |
|
|---|
| ArgC ESI |
|
|---|
| LysN ESI |
|
|---|
| TryLysC ESI |
|
|---|
| Try MALDI |
|
|---|
| ChTry MALDI |
|
|---|
| ArgC MALDI |
|
|---|
| LysN MALDI |
|
|---|
| TryLysC MALDI |
|
|---|
| Try LTQ |
|
|---|
| ChTry LTQ |
|
|---|
| ArgC LTQ |
|
|---|
| LysN LTQ |
|
|---|
| TryLysC LTQ |
|
|---|
| Try MSlow |
|
|---|
| ChTry MSlow |
|
|---|
| ArgC MSlow |
|
|---|
| LysN MSlow |
|
|---|
| TryLysC MSlow |
|
|---|
| Try MShigh |
|
|---|
| ChTry MShigh |
|
|---|
| ArgC MShigh |
|
|---|
| LysN MShigh |
|
|---|
| TryLysC MShigh |
|
|---|
General Statistics
Number of major isoforms |
Number of additional isoforms |
Number of all proteins |
Number of amino acids |
Min. Seq. Length |
Max. Seq. Length |
Avg. Seq. Length |
Avg. Mol. Weight |
|---|---|---|---|---|---|---|---|
0 |
15169 |
34 |
845 |
172.4 |
19.07 |
Amino acid frequency
Ala |
Cys |
Asp |
Glu |
Phe |
Gly |
His |
Ile |
Lys |
Leu |
|---|---|---|---|---|---|---|---|---|---|
9.856 ± 0.413 | 0.93 ± 0.147 |
6.388 ± 0.238 | 7.12 ± 0.43 |
3.336 ± 0.157 | 8.016 ± 0.385 |
1.991 ± 0.19 | 5.149 ± 0.18 |
4.845 ± 0.217 | 8.412 ± 0.382 |
Met |
Asn |
Gln |
Pro |
Arg |
Ser |
Thr |
Val |
Trp |
Tyr |
|---|---|---|---|---|---|---|---|---|---|
2.492 ± 0.159 | 3.349 ± 0.208 |
5.531 ± 0.272 | 3.784 ± 0.234 |
6.072 ± 0.393 | 5.142 ± 0.223 |
6.052 ± 0.344 | 6.863 ± 0.221 |
1.806 ± 0.146 | 2.861 ± 0.214 |
Most of the basic statistics you can see at this page can be downloaded from this CSV file
See this proteome in:

Proteome-pI is available under Creative Commons Attribution-NoDerivs license, for more details see here
| Reference: Kozlowski LP. Proteome-pI 2.0: Proteome Isoelectric Point Database Update. Nucleic Acids Res. 2021, doi: 10.1093/nar/gkab944 | Contact: Lukasz P. Kozlowski |