Acetobacter sp. CAG:267
Taxonomy: cellular organisms; Bacteria; Proteobacteria; Alphaproteobacteria; Rhodospirillales; Acetobacteraceae; Acetobacter; environmental samples
Average proteome isoelectric point is 6.77
Get precalculated fractions of proteins
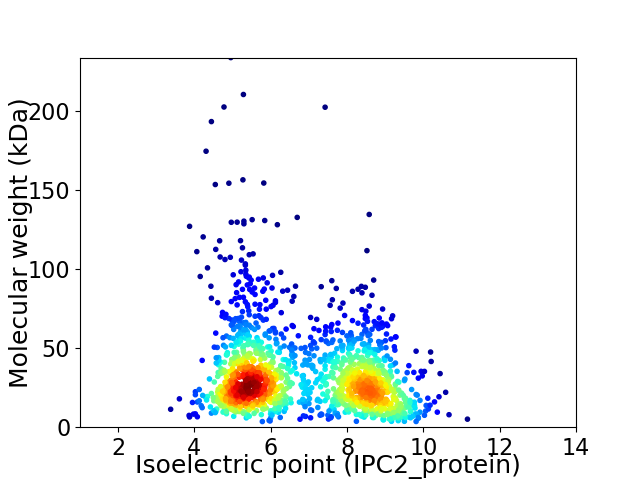
Virtual 2D-PAGE plot for 1538 proteins (isoelectric point calculated using IPC2_protein)
Get csv file with sequences according to given criteria:
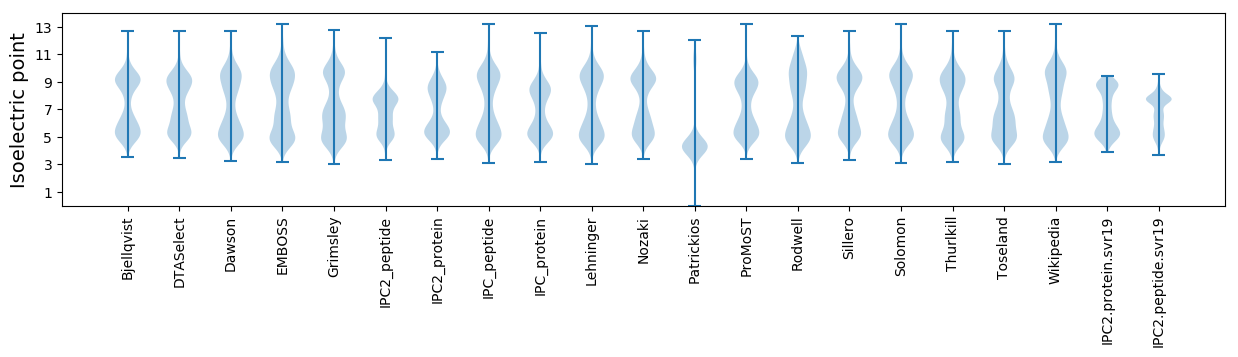
* You can choose from 21 different methods for calculating isoelectric point
Summary statistics related to proteome-wise predictions
Protein with the lowest isoelectric point:
>tr|R5YN98|R5YN98_9PROT Predicted permease OS=Acetobacter sp. CAG:267 OX=1262684 GN=BN575_00604 PE=4 SV=1
MM1 pKa = 7.43LTTLLIYY8 pKa = 10.86YY9 pKa = 7.51GGCALGLFGMAKK21 pKa = 9.71VVEE24 pKa = 4.74HH25 pKa = 6.56LPEE28 pKa = 6.0SDD30 pKa = 3.49GKK32 pKa = 11.42SSGTDD37 pKa = 3.21DD38 pKa = 4.44YY39 pKa = 11.93GSSSYY44 pKa = 11.39DD45 pKa = 3.39DD46 pKa = 4.15NLGFDD51 pKa = 4.47GEE53 pKa = 4.73PNGMPYY59 pKa = 9.4MPP61 pKa = 5.58
MM1 pKa = 7.43LTTLLIYY8 pKa = 10.86YY9 pKa = 7.51GGCALGLFGMAKK21 pKa = 9.71VVEE24 pKa = 4.74HH25 pKa = 6.56LPEE28 pKa = 6.0SDD30 pKa = 3.49GKK32 pKa = 11.42SSGTDD37 pKa = 3.21DD38 pKa = 4.44YY39 pKa = 11.93GSSSYY44 pKa = 11.39DD45 pKa = 3.39DD46 pKa = 4.15NLGFDD51 pKa = 4.47GEE53 pKa = 4.73PNGMPYY59 pKa = 9.4MPP61 pKa = 5.58
Molecular weight: 6.49 kDa
Isoelectric point according different methods:
Protein with the highest isoelectric point:
>tr|R5Y1K1|R5Y1K1_9PROT Uncharacterized protein OS=Acetobacter sp. CAG:267 OX=1262684 GN=BN575_01252 PE=4 SV=1
MM1 pKa = 7.35KK2 pKa = 9.43RR3 pKa = 11.84TYY5 pKa = 10.27QPSKK9 pKa = 9.43LVRR12 pKa = 11.84ARR14 pKa = 11.84RR15 pKa = 11.84HH16 pKa = 4.36GFRR19 pKa = 11.84TRR21 pKa = 11.84MATAGGRR28 pKa = 11.84KK29 pKa = 8.88VLAARR34 pKa = 11.84RR35 pKa = 11.84ARR37 pKa = 11.84GRR39 pKa = 11.84KK40 pKa = 9.03RR41 pKa = 11.84LSAA44 pKa = 4.03
MM1 pKa = 7.35KK2 pKa = 9.43RR3 pKa = 11.84TYY5 pKa = 10.27QPSKK9 pKa = 9.43LVRR12 pKa = 11.84ARR14 pKa = 11.84RR15 pKa = 11.84HH16 pKa = 4.36GFRR19 pKa = 11.84TRR21 pKa = 11.84MATAGGRR28 pKa = 11.84KK29 pKa = 8.88VLAARR34 pKa = 11.84RR35 pKa = 11.84ARR37 pKa = 11.84GRR39 pKa = 11.84KK40 pKa = 9.03RR41 pKa = 11.84LSAA44 pKa = 4.03
Molecular weight: 5.08 kDa
Isoelectric point according different methods:
Peptides (in silico digests for buttom-up proteomics)
Below you can find in silico digests of the whole proteome with Trypsin, Chymotrypsin, Trypsin+LysC, LysN, ArgC proteases suitable for different mass spec machines.| Try ESI |
 |
|---|
| ChTry ESI |
|
|---|
| ArgC ESI |
|
|---|
| LysN ESI |
|
|---|
| TryLysC ESI |
|
|---|
| Try MALDI |
|
|---|
| ChTry MALDI |
|
|---|
| ArgC MALDI |
|
|---|
| LysN MALDI |
|
|---|
| TryLysC MALDI |
|
|---|
| Try LTQ |
|
|---|
| ChTry LTQ |
|
|---|
| ArgC LTQ |
|
|---|
| LysN LTQ |
|
|---|
| TryLysC LTQ |
|
|---|
| Try MSlow |
|
|---|
| ChTry MSlow |
|
|---|
| ArgC MSlow |
|
|---|
| LysN MSlow |
|
|---|
| TryLysC MSlow |
|
|---|
| Try MShigh |
|
|---|
| ChTry MShigh |
|
|---|
| ArgC MShigh |
|
|---|
| LysN MShigh |
|
|---|
| TryLysC MShigh |
|
|---|
General Statistics
Number of major isoforms |
Number of additional isoforms |
Number of all proteins |
Number of amino acids |
Min. Seq. Length |
Max. Seq. Length |
Avg. Seq. Length |
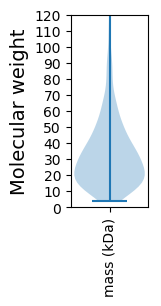
Avg. Mol. Weight |
|---|---|---|---|---|---|---|---|
0 |
481817 |
29 |
2195 |
313.3 |
34.99 |
Amino acid frequency
Ala |
Cys |
Asp |
Glu |
Phe |
Gly |
His |
Ile |
Lys |
Leu |
|---|---|---|---|---|---|---|---|---|---|
9.111 ± 0.079 | 1.287 ± 0.025 |
5.541 ± 0.054 | 6.775 ± 0.067 |
4.588 ± 0.053 | 7.001 ± 0.087 |
1.568 ± 0.023 | 6.536 ± 0.06 |
7.076 ± 0.072 | 9.305 ± 0.076 |
Met |
Asn |
Gln |
Pro |
Arg |
Ser |
Thr |
Val |
Trp |
Tyr |
|---|---|---|---|---|---|---|---|---|---|
2.511 ± 0.025 | 4.897 ± 0.059 |
3.641 ± 0.044 | 3.125 ± 0.038 |
4.969 ± 0.056 | 5.828 ± 0.049 |
4.934 ± 0.046 | 6.401 ± 0.058 |
0.992 ± 0.021 | 3.912 ± 0.052 |
Most of the basic statistics you can see at this page can be downloaded from this CSV file
See this proteome in:

Proteome-pI is available under Creative Commons Attribution-NoDerivs license, for more details see here
| Reference: Kozlowski LP. Proteome-pI 2.0: Proteome Isoelectric Point Database Update. Nucleic Acids Res. 2021, doi: 10.1093/nar/gkab944 | Contact: Lukasz P. Kozlowski |