Mycobacterium phage Tweety
Taxonomy: Viruses; Duplodnaviria; Heunggongvirae; Uroviricota; Caudoviricetes; Caudovirales; Siphoviridae; Cheoctovirus; Mycobacterium virus Tweety
Average proteome isoelectric point is 6.02
Get precalculated fractions of proteins
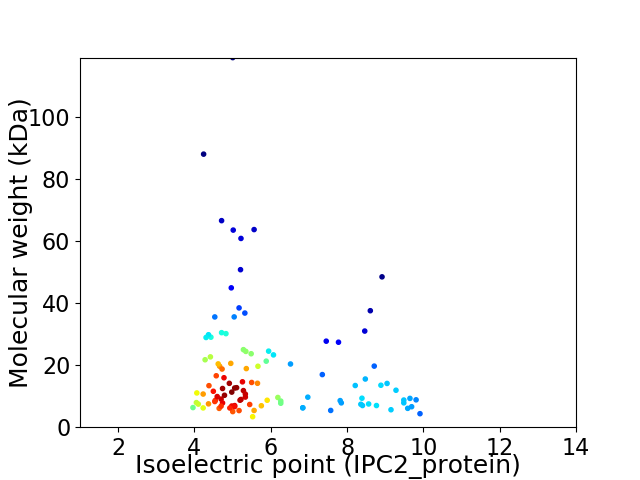
Virtual 2D-PAGE plot for 109 proteins (isoelectric point calculated using IPC2_protein)
Get csv file with sequences according to given criteria:
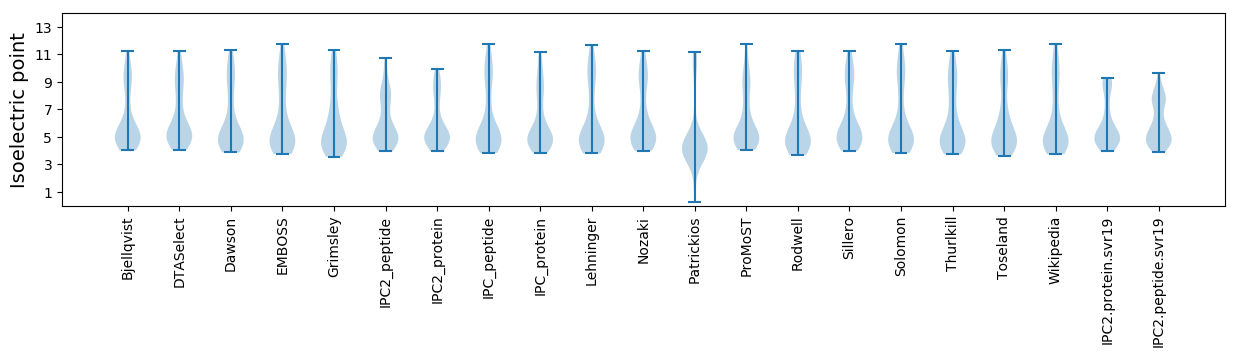
* You can choose from 21 different methods for calculating isoelectric point
Summary statistics related to proteome-wise predictions
Protein with the lowest isoelectric point:
>tr|A5YK11|A5YK11_9CAUD Integrase OS=Mycobacterium phage Tweety OX=439809 GN=43 PE=3 SV=1
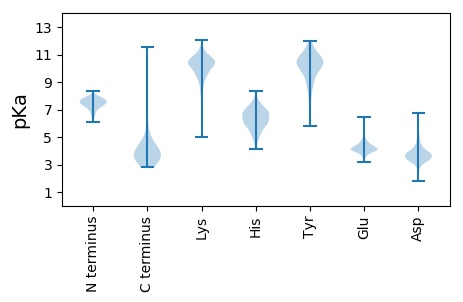
MM1 pKa = 7.85CGGCEE6 pKa = 4.05VKK8 pKa = 10.61SDD10 pKa = 3.51DD11 pKa = 3.64VRR13 pKa = 11.84YY14 pKa = 9.15EE15 pKa = 3.5VHH17 pKa = 6.52YY18 pKa = 10.88GDD20 pKa = 3.57KK21 pKa = 10.7TEE23 pKa = 4.67VFTSPYY29 pKa = 8.61ITQLWSWLGNVMEE42 pKa = 5.69PGDD45 pKa = 3.91TLHH48 pKa = 6.76WLSGGDD54 pKa = 3.7DD55 pKa = 3.31
MM1 pKa = 7.85CGGCEE6 pKa = 4.05VKK8 pKa = 10.61SDD10 pKa = 3.51DD11 pKa = 3.64VRR13 pKa = 11.84YY14 pKa = 9.15EE15 pKa = 3.5VHH17 pKa = 6.52YY18 pKa = 10.88GDD20 pKa = 3.57KK21 pKa = 10.7TEE23 pKa = 4.67VFTSPYY29 pKa = 8.61ITQLWSWLGNVMEE42 pKa = 5.69PGDD45 pKa = 3.91TLHH48 pKa = 6.76WLSGGDD54 pKa = 3.7DD55 pKa = 3.31
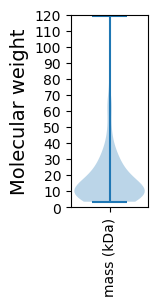
Molecular weight: 6.23 kDa
Isoelectric point according different methods:
Protein with the highest isoelectric point:
>tr|A5YK67|A5YK67_9CAUD Uncharacterized protein OS=Mycobacterium phage Tweety OX=439809 GN=99 PE=4 SV=1
MM1 pKa = 7.31RR2 pKa = 11.84RR3 pKa = 11.84AARR6 pKa = 11.84RR7 pKa = 11.84LIATSRR13 pKa = 11.84RR14 pKa = 11.84LDD16 pKa = 3.51PPKK19 pKa = 10.97DD20 pKa = 3.42EE21 pKa = 4.21TRR23 pKa = 11.84LYY25 pKa = 10.62AGNITPEE32 pKa = 4.06PWEE35 pKa = 4.23HH36 pKa = 6.76LDD38 pKa = 3.83LYY40 pKa = 10.63RR41 pKa = 11.84PPSLLTRR48 pKa = 11.84IWWCIRR54 pKa = 11.84GG55 pKa = 3.61
MM1 pKa = 7.31RR2 pKa = 11.84RR3 pKa = 11.84AARR6 pKa = 11.84RR7 pKa = 11.84LIATSRR13 pKa = 11.84RR14 pKa = 11.84LDD16 pKa = 3.51PPKK19 pKa = 10.97DD20 pKa = 3.42EE21 pKa = 4.21TRR23 pKa = 11.84LYY25 pKa = 10.62AGNITPEE32 pKa = 4.06PWEE35 pKa = 4.23HH36 pKa = 6.76LDD38 pKa = 3.83LYY40 pKa = 10.63RR41 pKa = 11.84PPSLLTRR48 pKa = 11.84IWWCIRR54 pKa = 11.84GG55 pKa = 3.61
Molecular weight: 6.62 kDa
Isoelectric point according different methods:
Peptides (in silico digests for buttom-up proteomics)
Below you can find in silico digests of the whole proteome with Trypsin, Chymotrypsin, Trypsin+LysC, LysN, ArgC proteases suitable for different mass spec machines.| Try ESI |
 |
|---|
| ChTry ESI |
|
|---|
| ArgC ESI |
|
|---|
| LysN ESI |
|
|---|
| TryLysC ESI |
|
|---|
| Try MALDI |
|
|---|
| ChTry MALDI |
|
|---|
| ArgC MALDI |
|
|---|
| LysN MALDI |
|
|---|
| TryLysC MALDI |
|
|---|
| Try LTQ |
|
|---|
| ChTry LTQ |
|
|---|
| ArgC LTQ |
|
|---|
| LysN LTQ |
|
|---|
| TryLysC LTQ |
|
|---|
| Try MSlow |
|
|---|
| ChTry MSlow |
|
|---|
| ArgC MSlow |
|
|---|
| LysN MSlow |
|
|---|
| TryLysC MSlow |
|
|---|
| Try MShigh |
|
|---|
| ChTry MShigh |
|
|---|
| ArgC MShigh |
|
|---|
| LysN MShigh |
|
|---|
| TryLysC MShigh |
|
|---|
General Statistics
Number of major isoforms |
Number of additional isoforms |
Number of all proteins |
Number of amino acids |
Min. Seq. Length |
Max. Seq. Length |
Avg. Seq. Length |
Avg. Mol. Weight |
|---|---|---|---|---|---|---|---|
0 |
18608 |
30 |
1176 |
170.7 |
18.62 |
Amino acid frequency
Ala |
Cys |
Asp |
Glu |
Phe |
Gly |
His |
Ile |
Lys |
Leu |
|---|---|---|---|---|---|---|---|---|---|
11.151 ± 0.582 | 1.182 ± 0.159 |
6.701 ± 0.194 | 5.842 ± 0.292 |
2.821 ± 0.205 | 8.975 ± 0.591 |
2.241 ± 0.188 | 4.294 ± 0.187 |
3.208 ± 0.168 | 7.389 ± 0.259 |
Met |
Asn |
Gln |
Pro |
Arg |
Ser |
Thr |
Val |
Trp |
Tyr |
|---|---|---|---|---|---|---|---|---|---|
2.246 ± 0.129 | 3.149 ± 0.18 |
5.911 ± 0.216 | 3.402 ± 0.177 |
6.82 ± 0.403 | 5.949 ± 0.259 |
6.712 ± 0.24 | 7.078 ± 0.269 |
2.451 ± 0.159 | 2.477 ± 0.133 |
Most of the basic statistics you can see at this page can be downloaded from this CSV file
See this proteome in:

Proteome-pI is available under Creative Commons Attribution-NoDerivs license, for more details see here
| Reference: Kozlowski LP. Proteome-pI 2.0: Proteome Isoelectric Point Database Update. Nucleic Acids Res. 2021, doi: 10.1093/nar/gkab944 | Contact: Lukasz P. Kozlowski |