Mannheimia varigena USDA-ARS-USMARC-1296
Taxonomy: cellular organisms; Bacteria; Proteobacteria; Gammaproteobacteria; Pasteurellales; Pasteurellaceae; Mannheimia; Mannheimia varigena
Average proteome isoelectric point is 6.43
Get precalculated fractions of proteins
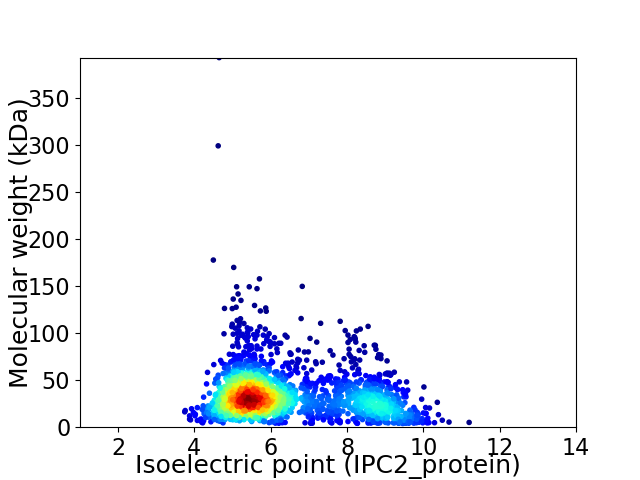
Virtual 2D-PAGE plot for 2108 proteins (isoelectric point calculated using IPC2_protein)
Get csv file with sequences according to given criteria:
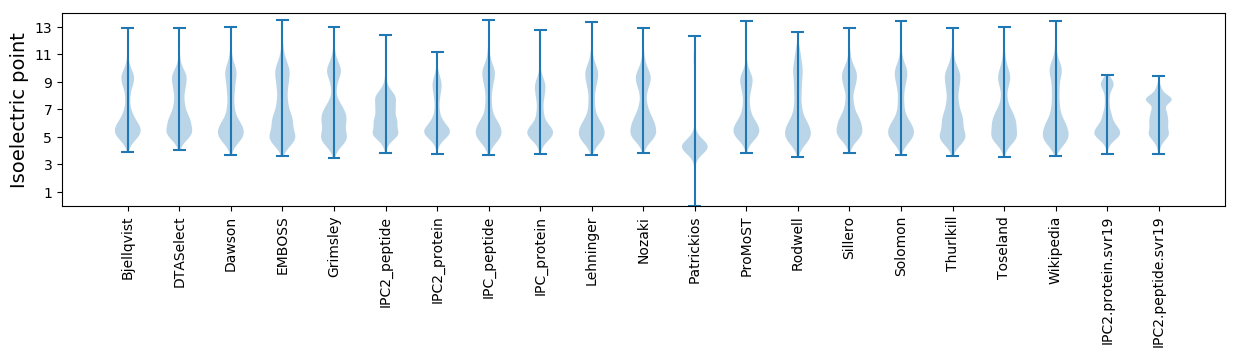
* You can choose from 21 different methods for calculating isoelectric point
Summary statistics related to proteome-wise predictions
Protein with the lowest isoelectric point:
>tr|W0Q962|W0Q962_9PAST Glucose-1-phosphate thymidylyltransferase OS=Mannheimia varigena USDA-ARS-USMARC-1296 OX=1433287 GN=X808_3050 PE=3 SV=1
MM1 pKa = 7.65NDD3 pKa = 2.81IQIPLIFTDD12 pKa = 3.67AAARR16 pKa = 11.84KK17 pKa = 9.3VKK19 pKa = 9.62TLIEE23 pKa = 4.56GEE25 pKa = 4.35DD26 pKa = 3.71NPNLRR31 pKa = 11.84LRR33 pKa = 11.84VYY35 pKa = 9.12ITGGGCSGFQYY46 pKa = 11.03GFTFDD51 pKa = 4.26DD52 pKa = 3.79QVNEE56 pKa = 3.92GDD58 pKa = 4.31LTIEE62 pKa = 4.05NQNVGLVVDD71 pKa = 4.64PMSLQYY77 pKa = 11.06LIGGTVDD84 pKa = 3.33YY85 pKa = 11.24TEE87 pKa = 5.04GLDD90 pKa = 3.4GSRR93 pKa = 11.84FVVTNPNASSTCGCGSSFSII113 pKa = 5.02
MM1 pKa = 7.65NDD3 pKa = 2.81IQIPLIFTDD12 pKa = 3.67AAARR16 pKa = 11.84KK17 pKa = 9.3VKK19 pKa = 9.62TLIEE23 pKa = 4.56GEE25 pKa = 4.35DD26 pKa = 3.71NPNLRR31 pKa = 11.84LRR33 pKa = 11.84VYY35 pKa = 9.12ITGGGCSGFQYY46 pKa = 11.03GFTFDD51 pKa = 4.26DD52 pKa = 3.79QVNEE56 pKa = 3.92GDD58 pKa = 4.31LTIEE62 pKa = 4.05NQNVGLVVDD71 pKa = 4.64PMSLQYY77 pKa = 11.06LIGGTVDD84 pKa = 3.33YY85 pKa = 11.24TEE87 pKa = 5.04GLDD90 pKa = 3.4GSRR93 pKa = 11.84FVVTNPNASSTCGCGSSFSII113 pKa = 5.02
Molecular weight: 12.14 kDa
Isoelectric point according different methods:
Protein with the highest isoelectric point:
>tr|W0Q7P6|W0Q7P6_9PAST Cytochrome c-type biogenesis protein CcmF OS=Mannheimia varigena USDA-ARS-USMARC-1296 OX=1433287 GN=X808_3890 PE=3 SV=1
MM1 pKa = 7.45KK2 pKa = 9.51RR3 pKa = 11.84TFQPSVLKK11 pKa = 10.49RR12 pKa = 11.84ARR14 pKa = 11.84THH16 pKa = 5.91GFRR19 pKa = 11.84ARR21 pKa = 11.84MATKK25 pKa = 10.4NGRR28 pKa = 11.84QVLARR33 pKa = 11.84RR34 pKa = 11.84RR35 pKa = 11.84AKK37 pKa = 10.15GRR39 pKa = 11.84KK40 pKa = 8.87SLSAA44 pKa = 3.86
MM1 pKa = 7.45KK2 pKa = 9.51RR3 pKa = 11.84TFQPSVLKK11 pKa = 10.49RR12 pKa = 11.84ARR14 pKa = 11.84THH16 pKa = 5.91GFRR19 pKa = 11.84ARR21 pKa = 11.84MATKK25 pKa = 10.4NGRR28 pKa = 11.84QVLARR33 pKa = 11.84RR34 pKa = 11.84RR35 pKa = 11.84AKK37 pKa = 10.15GRR39 pKa = 11.84KK40 pKa = 8.87SLSAA44 pKa = 3.86
Molecular weight: 5.08 kDa
Isoelectric point according different methods:
Peptides (in silico digests for buttom-up proteomics)
Below you can find in silico digests of the whole proteome with Trypsin, Chymotrypsin, Trypsin+LysC, LysN, ArgC proteases suitable for different mass spec machines.| Try ESI |
 |
|---|
| ChTry ESI |
|
|---|
| ArgC ESI |
|
|---|
| LysN ESI |
|
|---|
| TryLysC ESI |
|
|---|
| Try MALDI |
|
|---|
| ChTry MALDI |
|
|---|
| ArgC MALDI |
|
|---|
| LysN MALDI |
|
|---|
| TryLysC MALDI |
|
|---|
| Try LTQ |
|
|---|
| ChTry LTQ |
|
|---|
| ArgC LTQ |
|
|---|
| LysN LTQ |
|
|---|
| TryLysC LTQ |
|
|---|
| Try MSlow |
|
|---|
| ChTry MSlow |
|
|---|
| ArgC MSlow |
|
|---|
| LysN MSlow |
|
|---|
| TryLysC MSlow |
|
|---|
| Try MShigh |
|
|---|
| ChTry MShigh |
|
|---|
| ArgC MShigh |
|
|---|
| LysN MShigh |
|
|---|
| TryLysC MShigh |
|
|---|
General Statistics
Number of major isoforms |
Number of additional isoforms |
Number of all proteins |
Number of amino acids |
Min. Seq. Length |
Max. Seq. Length |
Avg. Seq. Length |
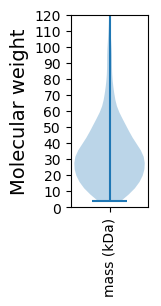
Avg. Mol. Weight |
|---|---|---|---|---|---|---|---|
0 |
667106 |
37 |
3855 |
316.5 |
35.26 |
Amino acid frequency
Ala |
Cys |
Asp |
Glu |
Phe |
Gly |
His |
Ile |
Lys |
Leu |
|---|---|---|---|---|---|---|---|---|---|
8.602 ± 0.07 | 0.987 ± 0.017 |
4.909 ± 0.041 | 6.636 ± 0.056 |
4.496 ± 0.041 | 6.81 ± 0.07 |
1.962 ± 0.026 | 7.014 ± 0.055 |
6.321 ± 0.049 | 10.328 ± 0.081 |
Met |
Asn |
Gln |
Pro |
Arg |
Ser |
Thr |
Val |
Trp |
Tyr |
|---|---|---|---|---|---|---|---|---|---|
2.445 ± 0.032 | 4.855 ± 0.057 |
3.77 ± 0.036 | 4.482 ± 0.048 |
4.224 ± 0.046 | 5.871 ± 0.042 |
5.207 ± 0.056 | 6.841 ± 0.05 |
1.137 ± 0.023 | 3.104 ± 0.036 |
Most of the basic statistics you can see at this page can be downloaded from this CSV file
See this proteome in:

Proteome-pI is available under Creative Commons Attribution-NoDerivs license, for more details see here
| Reference: Kozlowski LP. Proteome-pI 2.0: Proteome Isoelectric Point Database Update. Nucleic Acids Res. 2021, doi: 10.1093/nar/gkab944 | Contact: Lukasz P. Kozlowski |