Methanosarcina spherical virus
Taxonomy: Viruses; Varidnaviria; Bamfordvirae; Preplasmiviricota; Tectiliviricetes; Kalamavirales; Tectiviridae; unclassified Tectiviridae
Average proteome isoelectric point is 6.98
Get precalculated fractions of proteins
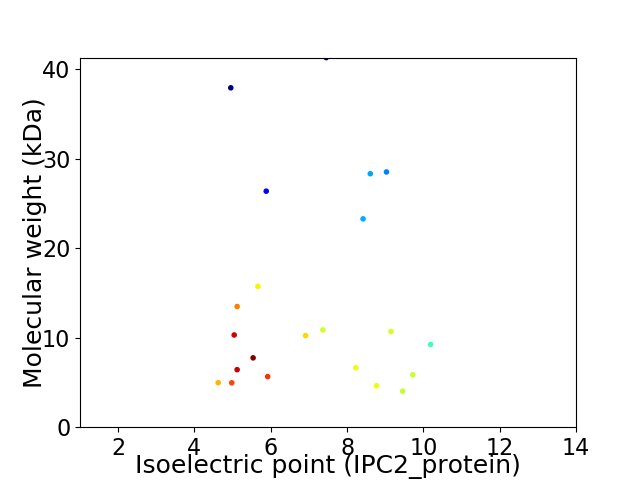
Virtual 2D-PAGE plot for 22 proteins (isoelectric point calculated using IPC2_protein)
Get csv file with sequences according to given criteria:
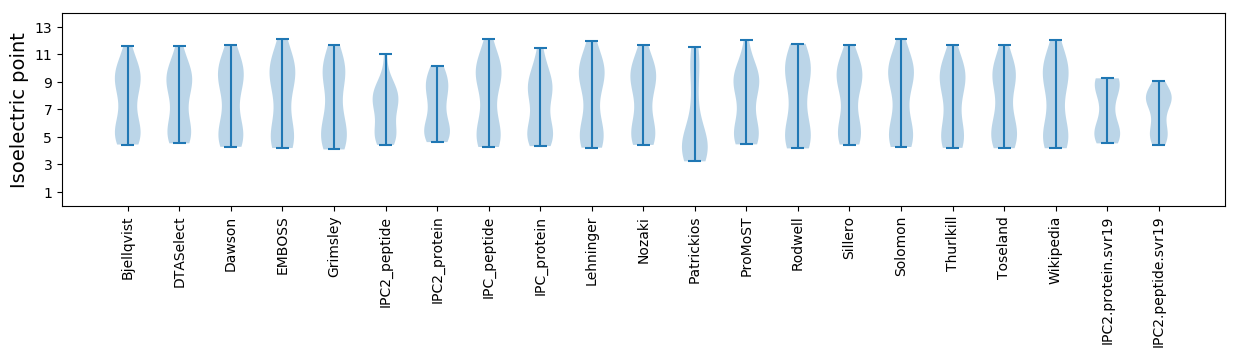
* You can choose from 21 different methods for calculating isoelectric point
Summary statistics related to proteome-wise predictions
Protein with the lowest isoelectric point:
>tr|A0A290GPG8|A0A290GPG8_9VIRU ORF12 OS=Methanosarcina spherical virus OX=2035535 PE=4 SV=1
MM1 pKa = 7.34FNSITNKK8 pKa = 9.68IYY10 pKa = 11.12SLMTRR15 pKa = 11.84FNTFLNTPLWEE26 pKa = 5.74DD27 pKa = 4.57DD28 pKa = 3.49LTKK31 pKa = 10.94CNEE34 pKa = 3.93KK35 pKa = 10.44EE36 pKa = 4.07QEE38 pKa = 3.5ADD40 pKa = 3.57YY41 pKa = 11.62
MM1 pKa = 7.34FNSITNKK8 pKa = 9.68IYY10 pKa = 11.12SLMTRR15 pKa = 11.84FNTFLNTPLWEE26 pKa = 5.74DD27 pKa = 4.57DD28 pKa = 3.49LTKK31 pKa = 10.94CNEE34 pKa = 3.93KK35 pKa = 10.44EE36 pKa = 4.07QEE38 pKa = 3.5ADD40 pKa = 3.57YY41 pKa = 11.62
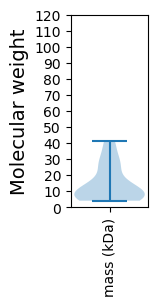
Molecular weight: 4.97 kDa
Isoelectric point according different methods:
Protein with the highest isoelectric point:
>tr|A0A290G8Q7|A0A290G8Q7_9VIRU Putative ATPase OS=Methanosarcina spherical virus OX=2035535 PE=4 SV=1
MM1 pKa = 7.72WSRR4 pKa = 11.84ILMVPLIIFTRR15 pKa = 11.84EE16 pKa = 3.42EE17 pKa = 3.6KK18 pKa = 9.85TALIFNEE25 pKa = 4.34KK26 pKa = 8.13TVKK29 pKa = 9.65TYY31 pKa = 10.86HH32 pKa = 6.58FDD34 pKa = 2.98QTIRR38 pKa = 11.84FRR40 pKa = 11.84VRR42 pKa = 11.84YY43 pKa = 8.81KK44 pKa = 11.03VKK46 pKa = 9.6TT47 pKa = 3.6
MM1 pKa = 7.72WSRR4 pKa = 11.84ILMVPLIIFTRR15 pKa = 11.84EE16 pKa = 3.42EE17 pKa = 3.6KK18 pKa = 9.85TALIFNEE25 pKa = 4.34KK26 pKa = 8.13TVKK29 pKa = 9.65TYY31 pKa = 10.86HH32 pKa = 6.58FDD34 pKa = 2.98QTIRR38 pKa = 11.84FRR40 pKa = 11.84VRR42 pKa = 11.84YY43 pKa = 8.81KK44 pKa = 11.03VKK46 pKa = 9.6TT47 pKa = 3.6
Molecular weight: 5.85 kDa
Isoelectric point according different methods:
Peptides (in silico digests for buttom-up proteomics)
Below you can find in silico digests of the whole proteome with Trypsin, Chymotrypsin, Trypsin+LysC, LysN, ArgC proteases suitable for different mass spec machines.| Try ESI |
 |
|---|
| ChTry ESI |
|
|---|
| ArgC ESI |
|
|---|
| LysN ESI |
|
|---|
| TryLysC ESI |
|
|---|
| Try MALDI |
|
|---|
| ChTry MALDI |
|
|---|
| ArgC MALDI |
|
|---|
| LysN MALDI |
|
|---|
| TryLysC MALDI |
|
|---|
| Try LTQ |
|
|---|
| ChTry LTQ |
|
|---|
| ArgC LTQ |
|
|---|
| LysN LTQ |
|
|---|
| TryLysC LTQ |
|
|---|
| Try MSlow |
|
|---|
| ChTry MSlow |
|
|---|
| ArgC MSlow |
|
|---|
| LysN MSlow |
|
|---|
| TryLysC MSlow |
|
|---|
| Try MShigh |
|
|---|
| ChTry MShigh |
|
|---|
| ArgC MShigh |
|
|---|
| LysN MShigh |
|
|---|
| TryLysC MShigh |
|
|---|
General Statistics
Number of major isoforms |
Number of additional isoforms |
Number of all proteins |
Number of amino acids |
Min. Seq. Length |
Max. Seq. Length |
Avg. Seq. Length |
Avg. Mol. Weight |
|---|---|---|---|---|---|---|---|
0 |
2817 |
33 |
359 |
128.0 |
14.41 |
Amino acid frequency
Ala |
Cys |
Asp |
Glu |
Phe |
Gly |
His |
Ile |
Lys |
Leu |
|---|---|---|---|---|---|---|---|---|---|
6.07 ± 0.637 | 1.739 ± 0.344 |
4.757 ± 0.314 | 7.171 ± 0.822 |
4.224 ± 0.501 | 7.277 ± 0.868 |
0.887 ± 0.224 | 7.455 ± 0.519 |
8.129 ± 0.813 | 7.952 ± 0.671 |
Met |
Asn |
Gln |
Pro |
Arg |
Ser |
Thr |
Val |
Trp |
Tyr |
|---|---|---|---|---|---|---|---|---|---|
2.236 ± 0.241 | 5.112 ± 0.412 |
3.656 ± 0.296 | 3.301 ± 0.349 |
5.218 ± 0.584 | 7.455 ± 0.935 |
6.674 ± 0.704 | 5.467 ± 0.523 |
0.923 ± 0.184 | 4.295 ± 0.648 |
Most of the basic statistics you can see at this page can be downloaded from this CSV file
See this proteome in:

Proteome-pI is available under Creative Commons Attribution-NoDerivs license, for more details see here
| Reference: Kozlowski LP. Proteome-pI 2.0: Proteome Isoelectric Point Database Update. Nucleic Acids Res. 2021, doi: 10.1093/nar/gkab944 | Contact: Lukasz P. Kozlowski |