Vibrio phage VPMS1
Taxonomy: Viruses; Duplodnaviria; Heunggongvirae; Uroviricota; Caudoviricetes; Caudovirales; Podoviridae; Kafunavirus; unclassified Kafunavirus
Average proteome isoelectric point is 5.88
Get precalculated fractions of proteins
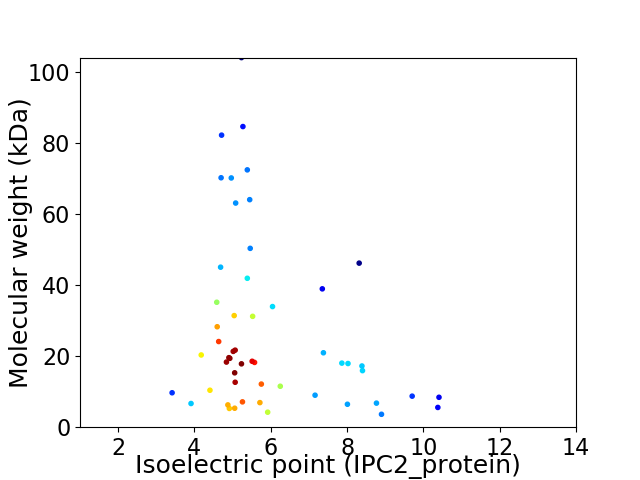
Virtual 2D-PAGE plot for 53 proteins (isoelectric point calculated using IPC2_protein)
Get csv file with sequences according to given criteria:
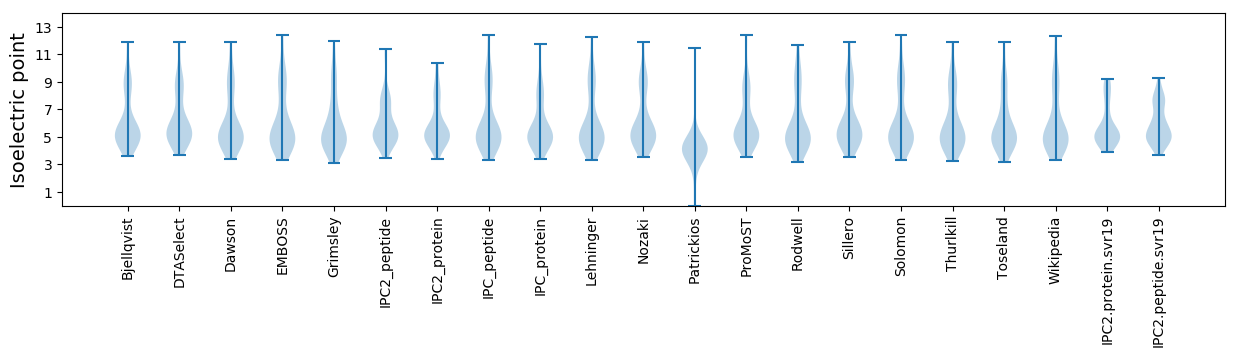
* You can choose from 21 different methods for calculating isoelectric point
Summary statistics related to proteome-wise predictions
Protein with the lowest isoelectric point:
>tr|S4T7Z0|S4T7Z0_9CAUD Head completion protein OS=Vibrio phage VPMS1 OX=1233488 GN=MS_007 PE=4 SV=1
MM1 pKa = 7.0TEE3 pKa = 4.98LYY5 pKa = 10.37IFDD8 pKa = 4.59HH9 pKa = 6.71VSDD12 pKa = 3.92SLVEE16 pKa = 4.18EE17 pKa = 4.64VACYY21 pKa = 10.11APCICSNNRR30 pKa = 11.84VVLFKK35 pKa = 10.91EE36 pKa = 4.27VFTDD40 pKa = 4.62LPCDD44 pKa = 3.73VQEE47 pKa = 5.22LLLEE51 pKa = 4.48CEE53 pKa = 4.87LIEE56 pKa = 4.98INN58 pKa = 4.74
MM1 pKa = 7.0TEE3 pKa = 4.98LYY5 pKa = 10.37IFDD8 pKa = 4.59HH9 pKa = 6.71VSDD12 pKa = 3.92SLVEE16 pKa = 4.18EE17 pKa = 4.64VACYY21 pKa = 10.11APCICSNNRR30 pKa = 11.84VVLFKK35 pKa = 10.91EE36 pKa = 4.27VFTDD40 pKa = 4.62LPCDD44 pKa = 3.73VQEE47 pKa = 5.22LLLEE51 pKa = 4.48CEE53 pKa = 4.87LIEE56 pKa = 4.98INN58 pKa = 4.74
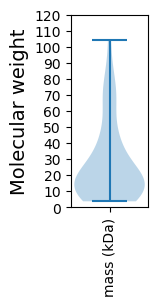
Molecular weight: 6.67 kDa
Isoelectric point according different methods:
Protein with the highest isoelectric point:
>tr|S4T7F1|S4T7F1_9CAUD Uncharacterized protein OS=Vibrio phage VPMS1 OX=1233488 GN=MS_020 PE=4 SV=1
MM1 pKa = 7.73LYY3 pKa = 10.06FHH5 pKa = 6.95NFSSSATRR13 pKa = 11.84NSKK16 pKa = 9.23TSSLDD21 pKa = 3.35FASVLVIRR29 pKa = 11.84VASTIVRR36 pKa = 11.84RR37 pKa = 11.84LSMILTASYY46 pKa = 9.65WPLPNQLRR54 pKa = 11.84TAKK57 pKa = 10.42SKK59 pKa = 10.37VNSVQVILASISTPMTLL76 pKa = 4.36
MM1 pKa = 7.73LYY3 pKa = 10.06FHH5 pKa = 6.95NFSSSATRR13 pKa = 11.84NSKK16 pKa = 9.23TSSLDD21 pKa = 3.35FASVLVIRR29 pKa = 11.84VASTIVRR36 pKa = 11.84RR37 pKa = 11.84LSMILTASYY46 pKa = 9.65WPLPNQLRR54 pKa = 11.84TAKK57 pKa = 10.42SKK59 pKa = 10.37VNSVQVILASISTPMTLL76 pKa = 4.36
Molecular weight: 8.42 kDa
Isoelectric point according different methods:
Peptides (in silico digests for buttom-up proteomics)
Below you can find in silico digests of the whole proteome with Trypsin, Chymotrypsin, Trypsin+LysC, LysN, ArgC proteases suitable for different mass spec machines.| Try ESI |
 |
|---|
| ChTry ESI |
|
|---|
| ArgC ESI |
|
|---|
| LysN ESI |
|
|---|
| TryLysC ESI |
|
|---|
| Try MALDI |
|
|---|
| ChTry MALDI |
|
|---|
| ArgC MALDI |
|
|---|
| LysN MALDI |
|
|---|
| TryLysC MALDI |
|
|---|
| Try LTQ |
|
|---|
| ChTry LTQ |
|
|---|
| ArgC LTQ |
|
|---|
| LysN LTQ |
|
|---|
| TryLysC LTQ |
|
|---|
| Try MSlow |
|
|---|
| ChTry MSlow |
|
|---|
| ArgC MSlow |
|
|---|
| LysN MSlow |
|
|---|
| TryLysC MSlow |
|
|---|
| Try MShigh |
|
|---|
| ChTry MShigh |
|
|---|
| ArgC MShigh |
|
|---|
| LysN MShigh |
|
|---|
| TryLysC MShigh |
|
|---|
General Statistics
Number of major isoforms |
Number of additional isoforms |
Number of all proteins |
Number of amino acids |
Min. Seq. Length |
Max. Seq. Length |
Avg. Seq. Length |
Avg. Mol. Weight |
|---|---|---|---|---|---|---|---|
0 |
12916 |
30 |
961 |
243.7 |
27.26 |
Amino acid frequency
Ala |
Cys |
Asp |
Glu |
Phe |
Gly |
His |
Ile |
Lys |
Leu |
|---|---|---|---|---|---|---|---|---|---|
8.215 ± 0.43 | 1.092 ± 0.141 |
6.364 ± 0.201 | 7.162 ± 0.229 |
3.577 ± 0.209 | 6.682 ± 0.363 |
1.734 ± 0.213 | 5.218 ± 0.151 |
6.651 ± 0.285 | 8.764 ± 0.255 |
Met |
Asn |
Gln |
Pro |
Arg |
Ser |
Thr |
Val |
Trp |
Tyr |
|---|---|---|---|---|---|---|---|---|---|
2.787 ± 0.161 | 4.7 ± 0.262 |
3.608 ± 0.168 | 4.057 ± 0.173 |
4.382 ± 0.272 | 6.449 ± 0.234 |
6.31 ± 0.288 | 6.867 ± 0.196 |
1.324 ± 0.103 | 4.057 ± 0.203 |
Most of the basic statistics you can see at this page can be downloaded from this CSV file
See this proteome in:

Proteome-pI is available under Creative Commons Attribution-NoDerivs license, for more details see here
| Reference: Kozlowski LP. Proteome-pI 2.0: Proteome Isoelectric Point Database Update. Nucleic Acids Res. 2021, doi: 10.1093/nar/gkab944 | Contact: Lukasz P. Kozlowski |