Pseudomonas phage TL
Taxonomy: Viruses; Duplodnaviria; Heunggongvirae; Uroviricota; Caudoviricetes; Caudovirales; Podoviridae; Bruynoghevirus; Pseudomonas virus TL
Average proteome isoelectric point is 6.23
Get precalculated fractions of proteins
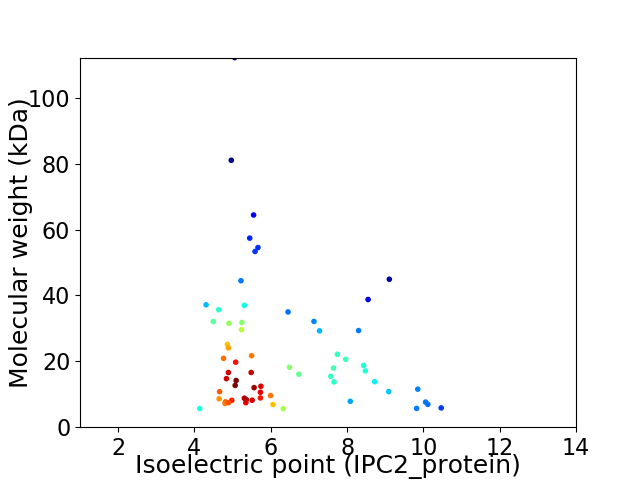
Virtual 2D-PAGE plot for 65 proteins (isoelectric point calculated using IPC2_protein)
Get csv file with sequences according to given criteria:
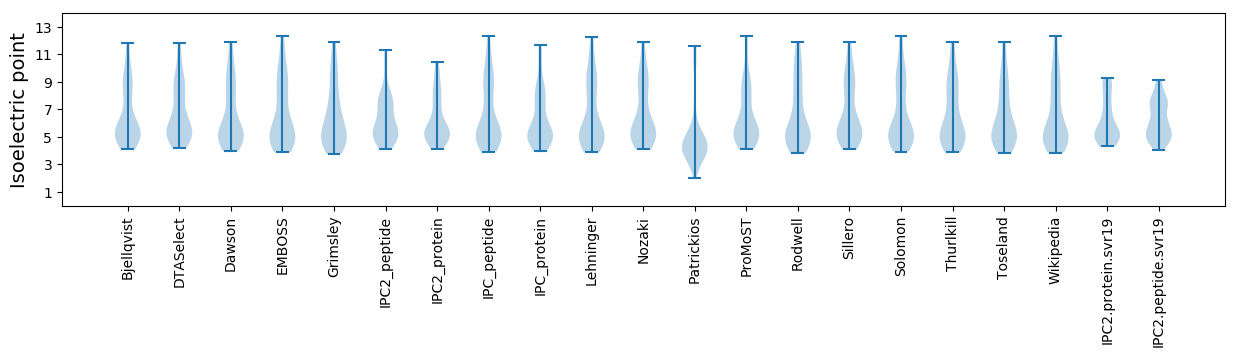
* You can choose from 21 different methods for calculating isoelectric point
Summary statistics related to proteome-wise predictions
Protein with the lowest isoelectric point:
>tr|W0XA69|W0XA69_9CAUD Endonuclease OS=Pseudomonas phage TL OX=1406974 GN=gp33 PE=4 SV=1
MM1 pKa = 7.53ASKK4 pKa = 10.65KK5 pKa = 10.38EE6 pKa = 4.02SLEE9 pKa = 3.98DD10 pKa = 3.39QARR13 pKa = 11.84KK14 pKa = 9.69EE15 pKa = 3.76IALEE19 pKa = 4.25KK20 pKa = 10.13EE21 pKa = 4.86FSGSWGGPEE30 pKa = 4.13IDD32 pKa = 5.3ADD34 pKa = 4.14DD35 pKa = 4.73FPLGSACGLDD45 pKa = 3.54PEE47 pKa = 4.75VCEE50 pKa = 4.54SCTT53 pKa = 3.71
MM1 pKa = 7.53ASKK4 pKa = 10.65KK5 pKa = 10.38EE6 pKa = 4.02SLEE9 pKa = 3.98DD10 pKa = 3.39QARR13 pKa = 11.84KK14 pKa = 9.69EE15 pKa = 3.76IALEE19 pKa = 4.25KK20 pKa = 10.13EE21 pKa = 4.86FSGSWGGPEE30 pKa = 4.13IDD32 pKa = 5.3ADD34 pKa = 4.14DD35 pKa = 4.73FPLGSACGLDD45 pKa = 3.54PEE47 pKa = 4.75VCEE50 pKa = 4.54SCTT53 pKa = 3.71
Molecular weight: 5.68 kDa
Isoelectric point according different methods:
Protein with the highest isoelectric point:
>tr|W0XA87|W0XA87_9CAUD Uncharacterized protein OS=Pseudomonas phage TL OX=1406974 GN=gp09 PE=4 SV=1
MM1 pKa = 7.57KK2 pKa = 10.34SPYY5 pKa = 9.36EE6 pKa = 4.13AAHH9 pKa = 5.98EE10 pKa = 3.94RR11 pKa = 11.84ALMVNRR17 pKa = 11.84LQKK20 pKa = 8.98LTRR23 pKa = 11.84MLRR26 pKa = 11.84VHH28 pKa = 7.34PDD30 pKa = 3.33PRR32 pKa = 11.84WKK34 pKa = 10.29QEE36 pKa = 3.6QQEE39 pKa = 4.33LIKK42 pKa = 10.52RR43 pKa = 11.84LKK45 pKa = 10.17RR46 pKa = 3.55
MM1 pKa = 7.57KK2 pKa = 10.34SPYY5 pKa = 9.36EE6 pKa = 4.13AAHH9 pKa = 5.98EE10 pKa = 3.94RR11 pKa = 11.84ALMVNRR17 pKa = 11.84LQKK20 pKa = 8.98LTRR23 pKa = 11.84MLRR26 pKa = 11.84VHH28 pKa = 7.34PDD30 pKa = 3.33PRR32 pKa = 11.84WKK34 pKa = 10.29QEE36 pKa = 3.6QQEE39 pKa = 4.33LIKK42 pKa = 10.52RR43 pKa = 11.84LKK45 pKa = 10.17RR46 pKa = 3.55
Molecular weight: 5.71 kDa
Isoelectric point according different methods:
Peptides (in silico digests for buttom-up proteomics)
Below you can find in silico digests of the whole proteome with Trypsin, Chymotrypsin, Trypsin+LysC, LysN, ArgC proteases suitable for different mass spec machines.| Try ESI |
 |
|---|
| ChTry ESI |
|
|---|
| ArgC ESI |
|
|---|
| LysN ESI |
|
|---|
| TryLysC ESI |
|
|---|
| Try MALDI |
|
|---|
| ChTry MALDI |
|
|---|
| ArgC MALDI |
|
|---|
| LysN MALDI |
|
|---|
| TryLysC MALDI |
|
|---|
| Try LTQ |
|
|---|
| ChTry LTQ |
|
|---|
| ArgC LTQ |
|
|---|
| LysN LTQ |
|
|---|
| TryLysC LTQ |
|
|---|
| Try MSlow |
|
|---|
| ChTry MSlow |
|
|---|
| ArgC MSlow |
|
|---|
| LysN MSlow |
|
|---|
| TryLysC MSlow |
|
|---|
| Try MShigh |
|
|---|
| ChTry MShigh |
|
|---|
| ArgC MShigh |
|
|---|
| LysN MShigh |
|
|---|
| TryLysC MShigh |
|
|---|
General Statistics
Number of major isoforms |
Number of additional isoforms |
Number of all proteins |
Number of amino acids |
Min. Seq. Length |
Max. Seq. Length |
Avg. Seq. Length |
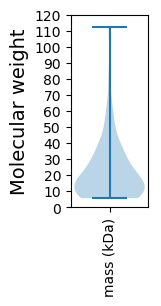
Avg. Mol. Weight |
|---|---|---|---|---|---|---|---|
0 |
13295 |
46 |
1055 |
204.5 |
22.82 |
Amino acid frequency
Ala |
Cys |
Asp |
Glu |
Phe |
Gly |
His |
Ile |
Lys |
Leu |
|---|---|---|---|---|---|---|---|---|---|
8.357 ± 0.659 | 1.061 ± 0.181 |
5.927 ± 0.259 | 7.266 ± 0.404 |
3.836 ± 0.186 | 8.379 ± 0.368 |
2.038 ± 0.229 | 5.039 ± 0.229 |
5.799 ± 0.331 | 8.244 ± 0.223 |
Met |
Asn |
Gln |
Pro |
Arg |
Ser |
Thr |
Val |
Trp |
Tyr |
|---|---|---|---|---|---|---|---|---|---|
2.791 ± 0.182 | 4.22 ± 0.228 |
4.355 ± 0.235 | 4.129 ± 0.294 |
5.844 ± 0.295 | 5.784 ± 0.268 |
5.19 ± 0.302 | 6.882 ± 0.221 |
1.722 ± 0.148 | 3.137 ± 0.209 |
Most of the basic statistics you can see at this page can be downloaded from this CSV file
See this proteome in:

Proteome-pI is available under Creative Commons Attribution-NoDerivs license, for more details see here
| Reference: Kozlowski LP. Proteome-pI 2.0: Proteome Isoelectric Point Database Update. Nucleic Acids Res. 2021, doi: 10.1093/nar/gkab944 | Contact: Lukasz P. Kozlowski |