Sulfolobus monocaudavirus SMV1
Taxonomy: Viruses; Bicaudaviridae; unclassified Bicaudaviridae
Average proteome isoelectric point is 6.75
Get precalculated fractions of proteins
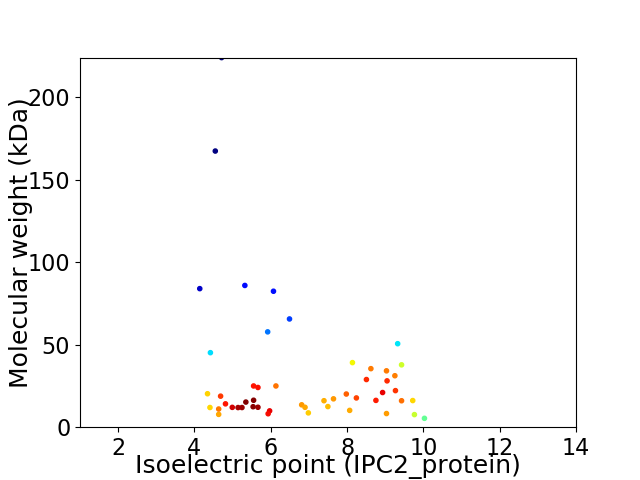
Virtual 2D-PAGE plot for 51 proteins (isoelectric point calculated using IPC2_protein)
Get csv file with sequences according to given criteria:
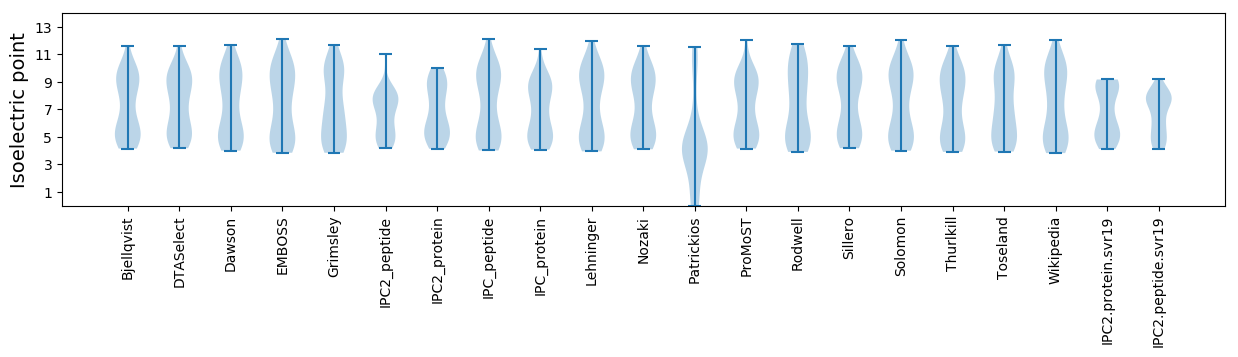
* You can choose from 21 different methods for calculating isoelectric point
Summary statistics related to proteome-wise predictions
Protein with the lowest isoelectric point:
>tr|W0UUX6|W0UUX6_9VIRU Conserved archaeal viral protein OS=Sulfolobus monocaudavirus SMV1 OX=1351702 PE=4 SV=1
MM1 pKa = 7.65GIIEE5 pKa = 5.02EE6 pKa = 4.29IQNALAYY13 pKa = 8.01YY14 pKa = 10.17QKK16 pKa = 9.75TAVDD20 pKa = 4.14EE21 pKa = 4.31NDD23 pKa = 3.1TLYY26 pKa = 11.31LHH28 pKa = 7.04NIYY31 pKa = 10.38SQLYY35 pKa = 8.26YY36 pKa = 10.13ILSVEE41 pKa = 4.05NRR43 pKa = 11.84PLNNTEE49 pKa = 4.15FDD51 pKa = 4.1SLMKK55 pKa = 10.8ALGINDD61 pKa = 3.72DD62 pKa = 3.87TLLVQEE68 pKa = 4.49YY69 pKa = 10.71QNMTDD74 pKa = 3.46EE75 pKa = 4.31QKK77 pKa = 10.87KK78 pKa = 9.17QLLMQILQMIDD89 pKa = 3.25NLMKK93 pKa = 10.7NIHH96 pKa = 5.51TMVNYY101 pKa = 10.42
MM1 pKa = 7.65GIIEE5 pKa = 5.02EE6 pKa = 4.29IQNALAYY13 pKa = 8.01YY14 pKa = 10.17QKK16 pKa = 9.75TAVDD20 pKa = 4.14EE21 pKa = 4.31NDD23 pKa = 3.1TLYY26 pKa = 11.31LHH28 pKa = 7.04NIYY31 pKa = 10.38SQLYY35 pKa = 8.26YY36 pKa = 10.13ILSVEE41 pKa = 4.05NRR43 pKa = 11.84PLNNTEE49 pKa = 4.15FDD51 pKa = 4.1SLMKK55 pKa = 10.8ALGINDD61 pKa = 3.72DD62 pKa = 3.87TLLVQEE68 pKa = 4.49YY69 pKa = 10.71QNMTDD74 pKa = 3.46EE75 pKa = 4.31QKK77 pKa = 10.87KK78 pKa = 9.17QLLMQILQMIDD89 pKa = 3.25NLMKK93 pKa = 10.7NIHH96 pKa = 5.51TMVNYY101 pKa = 10.42
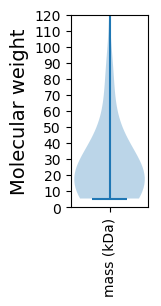
Molecular weight: 11.94 kDa
Isoelectric point according different methods:
Protein with the highest isoelectric point:
>tr|W0UUC6|W0UUC6_9VIRU Uncharacterized protein OS=Sulfolobus monocaudavirus SMV1 OX=1351702 PE=4 SV=1
MM1 pKa = 7.59RR2 pKa = 11.84SKK4 pKa = 9.79MRR6 pKa = 11.84QGGKK10 pKa = 7.07EE11 pKa = 3.76ARR13 pKa = 11.84GKK15 pKa = 9.71GMRR18 pKa = 11.84WSSINNISCSVNKK31 pKa = 10.35LFGQPPVQLLFTLQLMGG48 pKa = 4.35
MM1 pKa = 7.59RR2 pKa = 11.84SKK4 pKa = 9.79MRR6 pKa = 11.84QGGKK10 pKa = 7.07EE11 pKa = 3.76ARR13 pKa = 11.84GKK15 pKa = 9.71GMRR18 pKa = 11.84WSSINNISCSVNKK31 pKa = 10.35LFGQPPVQLLFTLQLMGG48 pKa = 4.35
Molecular weight: 5.38 kDa
Isoelectric point according different methods:
Peptides (in silico digests for buttom-up proteomics)
Below you can find in silico digests of the whole proteome with Trypsin, Chymotrypsin, Trypsin+LysC, LysN, ArgC proteases suitable for different mass spec machines.| Try ESI |
 |
|---|
| ChTry ESI |
|
|---|
| ArgC ESI |
|
|---|
| LysN ESI |
|
|---|
| TryLysC ESI |
|
|---|
| Try MALDI |
|
|---|
| ChTry MALDI |
|
|---|
| ArgC MALDI |
|
|---|
| LysN MALDI |
|
|---|
| TryLysC MALDI |
|
|---|
| Try LTQ |
|
|---|
| ChTry LTQ |
|
|---|
| ArgC LTQ |
|
|---|
| LysN LTQ |
|
|---|
| TryLysC LTQ |
|
|---|
| Try MSlow |
|
|---|
| ChTry MSlow |
|
|---|
| ArgC MSlow |
|
|---|
| LysN MSlow |
|
|---|
| TryLysC MSlow |
|
|---|
| Try MShigh |
|
|---|
| ChTry MShigh |
|
|---|
| ArgC MShigh |
|
|---|
| LysN MShigh |
|
|---|
| TryLysC MShigh |
|
|---|
General Statistics
Number of major isoforms |
Number of additional isoforms |
Number of all proteins |
Number of amino acids |
Min. Seq. Length |
Max. Seq. Length |
Avg. Seq. Length |
Avg. Mol. Weight |
|---|---|---|---|---|---|---|---|
0 |
14287 |
48 |
2028 |
280.1 |
31.52 |
Amino acid frequency
Ala |
Cys |
Asp |
Glu |
Phe |
Gly |
His |
Ile |
Lys |
Leu |
|---|---|---|---|---|---|---|---|---|---|
5.774 ± 0.428 | 0.434 ± 0.121 |
4.011 ± 0.43 | 5.942 ± 0.912 |
4.613 ± 0.385 | 5.236 ± 0.586 |
1.043 ± 0.128 | 8.588 ± 0.397 |
6.278 ± 0.728 | 10.023 ± 0.515 |
Met |
Asn |
Gln |
Pro |
Arg |
Ser |
Thr |
Val |
Trp |
Tyr |
|---|---|---|---|---|---|---|---|---|---|
1.862 ± 0.24 | 6.481 ± 0.499 |
3.976 ± 0.389 | 5.089 ± 0.765 |
2.898 ± 0.445 | 8.238 ± 0.754 |
6.628 ± 0.596 | 7.041 ± 0.42 |
0.798 ± 0.188 | 5.04 ± 0.359 |
Most of the basic statistics you can see at this page can be downloaded from this CSV file
See this proteome in:

Proteome-pI is available under Creative Commons Attribution-NoDerivs license, for more details see here
| Reference: Kozlowski LP. Proteome-pI 2.0: Proteome Isoelectric Point Database Update. Nucleic Acids Res. 2021, doi: 10.1093/nar/gkab944 | Contact: Lukasz P. Kozlowski |