Microbacterium oleivorans
Taxonomy: cellular organisms; Bacteria; Terrabacteria group; Actinobacteria; Actinomycetia; Micrococcales; Microbacteriaceae;
Average proteome isoelectric point is 6.0
Get precalculated fractions of proteins
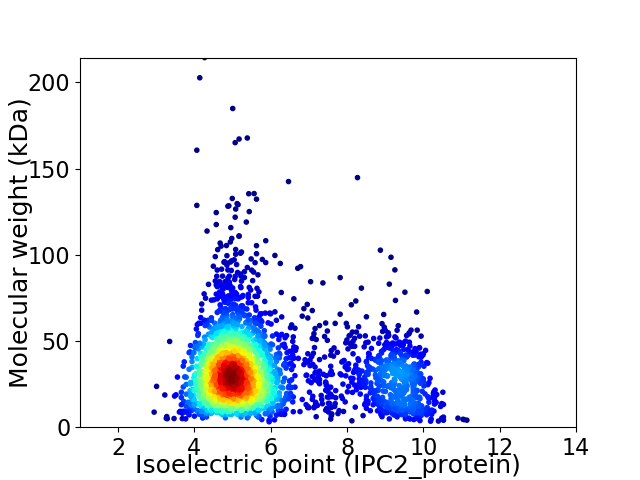
Virtual 2D-PAGE plot for 2781 proteins (isoelectric point calculated using IPC2_protein)
Get csv file with sequences according to given criteria:
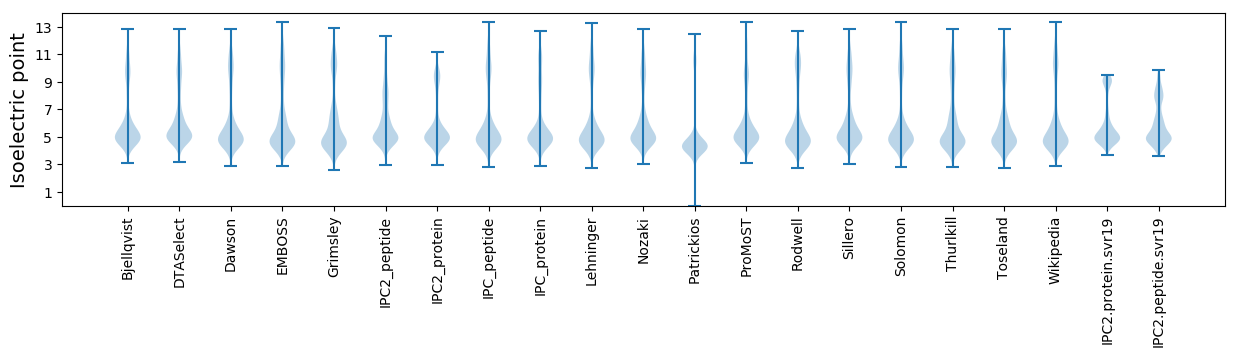
* You can choose from 21 different methods for calculating isoelectric point
Summary statistics related to proteome-wise predictions
Protein with the lowest isoelectric point:
>tr|A0A031FRG5|A0A031FRG5_9MICO Putative N-acetylglucosamine kinase OS=Microbacterium oleivorans OX=273677 GN=BW34_02517 PE=4 SV=1
MM1 pKa = 6.72TVRR4 pKa = 11.84RR5 pKa = 11.84ALPLLAATALLLTGCAGQSPPPRR28 pKa = 11.84YY29 pKa = 9.81LPGGPQVPPAGAVLDD44 pKa = 4.09YY45 pKa = 10.98QLGGAYY51 pKa = 9.78DD52 pKa = 3.82PPNGVEE58 pKa = 3.64IVVRR62 pKa = 11.84DD63 pKa = 3.83RR64 pKa = 11.84AAASIDD70 pKa = 3.47DD71 pKa = 4.9LYY73 pKa = 11.49SVCYY77 pKa = 10.73VNGFQTQPGEE87 pKa = 4.08LDD89 pKa = 3.4VWPDD93 pKa = 3.57DD94 pKa = 4.49LLLRR98 pKa = 11.84DD99 pKa = 4.64DD100 pKa = 5.23DD101 pKa = 4.67GEE103 pKa = 4.24PVIDD107 pKa = 4.83PDD109 pKa = 3.66WPDD112 pKa = 3.38EE113 pKa = 4.44VILDD117 pKa = 3.63TRR119 pKa = 11.84KK120 pKa = 9.98ADD122 pKa = 4.37EE123 pKa = 3.86IAKK126 pKa = 10.03IVGPWIRR133 pKa = 11.84DD134 pKa = 3.61CASDD138 pKa = 3.96GFDD141 pKa = 4.14AVEE144 pKa = 4.15FDD146 pKa = 4.79NLDD149 pKa = 3.37TYY151 pKa = 11.1TRR153 pKa = 11.84TDD155 pKa = 3.23GALSRR160 pKa = 11.84DD161 pKa = 3.95DD162 pKa = 5.25ALDD165 pKa = 3.86LATLLVDD172 pKa = 3.84TAHH175 pKa = 7.38DD176 pKa = 3.67VGLAAGQKK184 pKa = 9.41NAAEE188 pKa = 4.54DD189 pKa = 3.51ASLLHH194 pKa = 6.29SRR196 pKa = 11.84AGFDD200 pKa = 3.23FAVVEE205 pKa = 4.28EE206 pKa = 4.37CAAYY210 pKa = 9.6EE211 pKa = 3.87EE212 pKa = 4.77CAAYY216 pKa = 9.47TEE218 pKa = 4.81VYY220 pKa = 10.04GEE222 pKa = 3.99NVLAIEE228 pKa = 4.38YY229 pKa = 8.94TDD231 pKa = 3.54NLPRR235 pKa = 11.84PWDD238 pKa = 3.79EE239 pKa = 4.0VCADD243 pKa = 3.98PEE245 pKa = 4.58TPASVVLRR253 pKa = 11.84DD254 pKa = 3.9RR255 pKa = 11.84DD256 pKa = 4.02LVTPDD261 pKa = 3.22DD262 pKa = 4.29PGYY265 pKa = 11.15VLEE268 pKa = 4.56TCGG271 pKa = 4.4
MM1 pKa = 6.72TVRR4 pKa = 11.84RR5 pKa = 11.84ALPLLAATALLLTGCAGQSPPPRR28 pKa = 11.84YY29 pKa = 9.81LPGGPQVPPAGAVLDD44 pKa = 4.09YY45 pKa = 10.98QLGGAYY51 pKa = 9.78DD52 pKa = 3.82PPNGVEE58 pKa = 3.64IVVRR62 pKa = 11.84DD63 pKa = 3.83RR64 pKa = 11.84AAASIDD70 pKa = 3.47DD71 pKa = 4.9LYY73 pKa = 11.49SVCYY77 pKa = 10.73VNGFQTQPGEE87 pKa = 4.08LDD89 pKa = 3.4VWPDD93 pKa = 3.57DD94 pKa = 4.49LLLRR98 pKa = 11.84DD99 pKa = 4.64DD100 pKa = 5.23DD101 pKa = 4.67GEE103 pKa = 4.24PVIDD107 pKa = 4.83PDD109 pKa = 3.66WPDD112 pKa = 3.38EE113 pKa = 4.44VILDD117 pKa = 3.63TRR119 pKa = 11.84KK120 pKa = 9.98ADD122 pKa = 4.37EE123 pKa = 3.86IAKK126 pKa = 10.03IVGPWIRR133 pKa = 11.84DD134 pKa = 3.61CASDD138 pKa = 3.96GFDD141 pKa = 4.14AVEE144 pKa = 4.15FDD146 pKa = 4.79NLDD149 pKa = 3.37TYY151 pKa = 11.1TRR153 pKa = 11.84TDD155 pKa = 3.23GALSRR160 pKa = 11.84DD161 pKa = 3.95DD162 pKa = 5.25ALDD165 pKa = 3.86LATLLVDD172 pKa = 3.84TAHH175 pKa = 7.38DD176 pKa = 3.67VGLAAGQKK184 pKa = 9.41NAAEE188 pKa = 4.54DD189 pKa = 3.51ASLLHH194 pKa = 6.29SRR196 pKa = 11.84AGFDD200 pKa = 3.23FAVVEE205 pKa = 4.28EE206 pKa = 4.37CAAYY210 pKa = 9.6EE211 pKa = 3.87EE212 pKa = 4.77CAAYY216 pKa = 9.47TEE218 pKa = 4.81VYY220 pKa = 10.04GEE222 pKa = 3.99NVLAIEE228 pKa = 4.38YY229 pKa = 8.94TDD231 pKa = 3.54NLPRR235 pKa = 11.84PWDD238 pKa = 3.79EE239 pKa = 4.0VCADD243 pKa = 3.98PEE245 pKa = 4.58TPASVVLRR253 pKa = 11.84DD254 pKa = 3.9RR255 pKa = 11.84DD256 pKa = 4.02LVTPDD261 pKa = 3.22DD262 pKa = 4.29PGYY265 pKa = 11.15VLEE268 pKa = 4.56TCGG271 pKa = 4.4
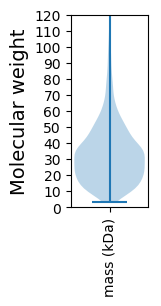
Molecular weight: 29.19 kDa
Isoelectric point according different methods:
Protein with the highest isoelectric point:
>tr|A0A031FTN2|A0A031FTN2_9MICO Cysteine desulfurase OS=Microbacterium oleivorans OX=273677 GN=BW34_02204 PE=3 SV=1
MM1 pKa = 7.4GSVIKK6 pKa = 10.42KK7 pKa = 8.47RR8 pKa = 11.84RR9 pKa = 11.84KK10 pKa = 9.22RR11 pKa = 11.84MAKK14 pKa = 9.41KK15 pKa = 9.87KK16 pKa = 9.7HH17 pKa = 5.84RR18 pKa = 11.84KK19 pKa = 8.56LLRR22 pKa = 11.84KK23 pKa = 7.78TRR25 pKa = 11.84HH26 pKa = 3.65QRR28 pKa = 11.84RR29 pKa = 11.84NKK31 pKa = 9.78KK32 pKa = 9.85
MM1 pKa = 7.4GSVIKK6 pKa = 10.42KK7 pKa = 8.47RR8 pKa = 11.84RR9 pKa = 11.84KK10 pKa = 9.22RR11 pKa = 11.84MAKK14 pKa = 9.41KK15 pKa = 9.87KK16 pKa = 9.7HH17 pKa = 5.84RR18 pKa = 11.84KK19 pKa = 8.56LLRR22 pKa = 11.84KK23 pKa = 7.78TRR25 pKa = 11.84HH26 pKa = 3.65QRR28 pKa = 11.84RR29 pKa = 11.84NKK31 pKa = 9.78KK32 pKa = 9.85
Molecular weight: 4.08 kDa
Isoelectric point according different methods:
Peptides (in silico digests for buttom-up proteomics)
Below you can find in silico digests of the whole proteome with Trypsin, Chymotrypsin, Trypsin+LysC, LysN, ArgC proteases suitable for different mass spec machines.| Try ESI |
 |
|---|
| ChTry ESI |
|
|---|
| ArgC ESI |
|
|---|
| LysN ESI |
|
|---|
| TryLysC ESI |
|
|---|
| Try MALDI |
|
|---|
| ChTry MALDI |
|
|---|
| ArgC MALDI |
|
|---|
| LysN MALDI |
|
|---|
| TryLysC MALDI |
|
|---|
| Try LTQ |
|
|---|
| ChTry LTQ |
|
|---|
| ArgC LTQ |
|
|---|
| LysN LTQ |
|
|---|
| TryLysC LTQ |
|
|---|
| Try MSlow |
|
|---|
| ChTry MSlow |
|
|---|
| ArgC MSlow |
|
|---|
| LysN MSlow |
|
|---|
| TryLysC MSlow |
|
|---|
| Try MShigh |
|
|---|
| ChTry MShigh |
|
|---|
| ArgC MShigh |
|
|---|
| LysN MShigh |
|
|---|
| TryLysC MShigh |
|
|---|
General Statistics
Number of major isoforms |
Number of additional isoforms |
Number of all proteins |
Number of amino acids |
Min. Seq. Length |
Max. Seq. Length |
Avg. Seq. Length |
Avg. Mol. Weight |
|---|---|---|---|---|---|---|---|
0 |
897455 |
29 |
2036 |
322.7 |
34.52 |
Amino acid frequency
Ala |
Cys |
Asp |
Glu |
Phe |
Gly |
His |
Ile |
Lys |
Leu |
|---|---|---|---|---|---|---|---|---|---|
13.58 ± 0.067 | 0.445 ± 0.011 |
6.544 ± 0.045 | 5.566 ± 0.042 |
3.145 ± 0.031 | 8.887 ± 0.039 |
1.939 ± 0.024 | 4.548 ± 0.038 |
1.987 ± 0.031 | 9.909 ± 0.047 |
Met |
Asn |
Gln |
Pro |
Arg |
Ser |
Thr |
Val |
Trp |
Tyr |
|---|---|---|---|---|---|---|---|---|---|
1.762 ± 0.017 | 1.841 ± 0.024 |
5.381 ± 0.035 | 2.612 ± 0.023 |
7.451 ± 0.051 | 5.627 ± 0.034 |
6.11 ± 0.036 | 9.2 ± 0.04 |
1.532 ± 0.022 | 1.934 ± 0.02 |
Most of the basic statistics you can see at this page can be downloaded from this CSV file
See this proteome in:

Proteome-pI is available under Creative Commons Attribution-NoDerivs license, for more details see here
| Reference: Kozlowski LP. Proteome-pI 2.0: Proteome Isoelectric Point Database Update. Nucleic Acids Res. 2021, doi: 10.1093/nar/gkab944 | Contact: Lukasz P. Kozlowski |