Canada goose coronavirus
Taxonomy: Viruses; Riboviria; Orthornavirae; Pisuviricota; Pisoniviricetes; Nidovirales; Cornidovirineae; Coronaviridae; Orthocoronavirinae; Gammacoronavirus; unclassified Gammacoronavirus
Average proteome isoelectric point is 7.12
Get precalculated fractions of proteins
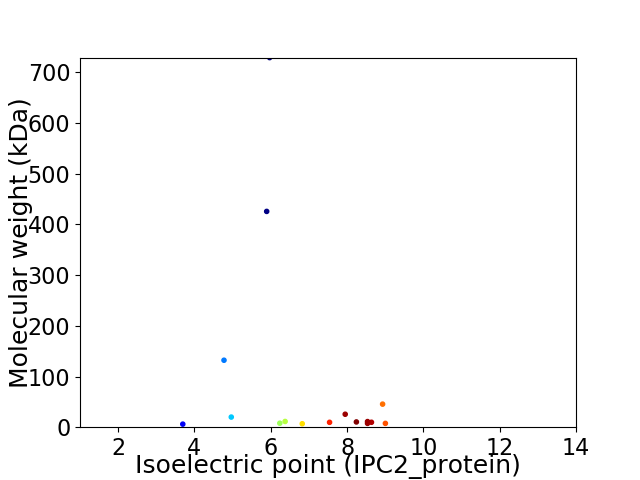
Virtual 2D-PAGE plot for 16 proteins (isoelectric point calculated using IPC2_protein)
Get csv file with sequences according to given criteria:
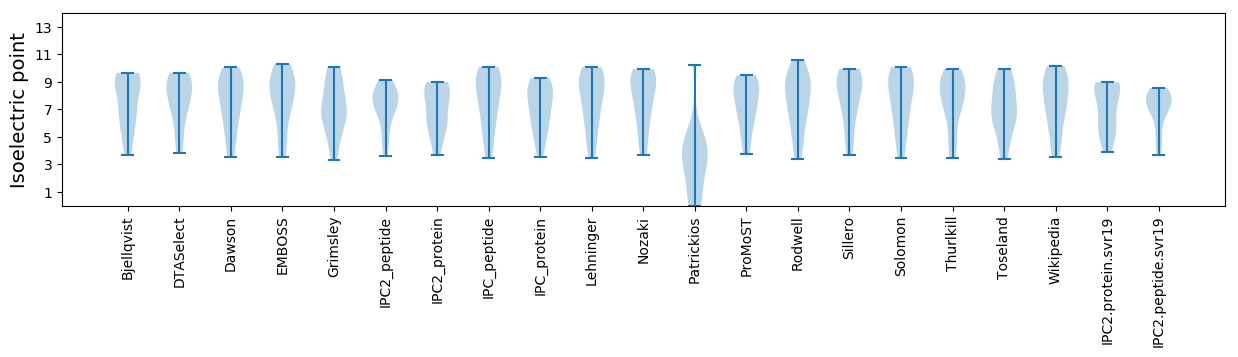
* You can choose from 21 different methods for calculating isoelectric point
Summary statistics related to proteome-wise predictions
Protein with the lowest isoelectric point:
>tr|A0A4D6FUX7|A0A4D6FUX7_9GAMC Envelope protein OS=Canada goose coronavirus OX=2569586 PE=4 SV=1
MM1 pKa = 7.68SDD3 pKa = 4.81DD4 pKa = 4.13SSCCIHH10 pKa = 6.43NPCLSEE16 pKa = 3.51WCVYY20 pKa = 10.29CNPPDD25 pKa = 3.76EE26 pKa = 5.27DD27 pKa = 3.82VPLHH31 pKa = 5.52VLSFIINSQQEE42 pKa = 4.4LLEE45 pKa = 5.16LIDD48 pKa = 6.0LLFEE52 pKa = 4.37SS53 pKa = 4.96
MM1 pKa = 7.68SDD3 pKa = 4.81DD4 pKa = 4.13SSCCIHH10 pKa = 6.43NPCLSEE16 pKa = 3.51WCVYY20 pKa = 10.29CNPPDD25 pKa = 3.76EE26 pKa = 5.27DD27 pKa = 3.82VPLHH31 pKa = 5.52VLSFIINSQQEE42 pKa = 4.4LLEE45 pKa = 5.16LIDD48 pKa = 6.0LLFEE52 pKa = 4.37SS53 pKa = 4.96
Molecular weight: 6.06 kDa
Isoelectric point according different methods:
Protein with the highest isoelectric point:
>tr|A0A4D6FTX3|A0A4D6FTX3_9GAMC ORF3 OS=Canada goose coronavirus OX=2569586 PE=4 SV=1
MM1 pKa = 7.5NNPFATATARR11 pKa = 11.84KK12 pKa = 9.54ARR14 pKa = 11.84VVCLNRR20 pKa = 11.84GARR23 pKa = 11.84SVYY26 pKa = 9.97FLNKK30 pKa = 9.38QGLPVPCPHH39 pKa = 6.77CTTLVVRR46 pKa = 11.84GLLCEE51 pKa = 3.94EE52 pKa = 4.7HH53 pKa = 6.75QFDD56 pKa = 4.55DD57 pKa = 4.09NIYY60 pKa = 10.24IGWHH64 pKa = 5.92PEE66 pKa = 3.33GTLEE70 pKa = 4.56HH71 pKa = 6.68ARR73 pKa = 11.84TRR75 pKa = 11.84VGNRR79 pKa = 11.84MLQHH83 pKa = 6.91RR84 pKa = 11.84FF85 pKa = 3.16
MM1 pKa = 7.5NNPFATATARR11 pKa = 11.84KK12 pKa = 9.54ARR14 pKa = 11.84VVCLNRR20 pKa = 11.84GARR23 pKa = 11.84SVYY26 pKa = 9.97FLNKK30 pKa = 9.38QGLPVPCPHH39 pKa = 6.77CTTLVVRR46 pKa = 11.84GLLCEE51 pKa = 3.94EE52 pKa = 4.7HH53 pKa = 6.75QFDD56 pKa = 4.55DD57 pKa = 4.09NIYY60 pKa = 10.24IGWHH64 pKa = 5.92PEE66 pKa = 3.33GTLEE70 pKa = 4.56HH71 pKa = 6.68ARR73 pKa = 11.84TRR75 pKa = 11.84VGNRR79 pKa = 11.84MLQHH83 pKa = 6.91RR84 pKa = 11.84FF85 pKa = 3.16
Molecular weight: 9.73 kDa
Isoelectric point according different methods:
Peptides (in silico digests for buttom-up proteomics)
Below you can find in silico digests of the whole proteome with Trypsin, Chymotrypsin, Trypsin+LysC, LysN, ArgC proteases suitable for different mass spec machines.| Try ESI |
 |
|---|
| ChTry ESI |
|
|---|
| ArgC ESI |
|
|---|
| LysN ESI |
|
|---|
| TryLysC ESI |
|
|---|
| Try MALDI |
|
|---|
| ChTry MALDI |
|
|---|
| ArgC MALDI |
|
|---|
| LysN MALDI |
|
|---|
| TryLysC MALDI |
|
|---|
| Try LTQ |
|
|---|
| ChTry LTQ |
|
|---|
| ArgC LTQ |
|
|---|
| LysN LTQ |
|
|---|
| TryLysC LTQ |
|
|---|
| Try MSlow |
|
|---|
| ChTry MSlow |
|
|---|
| ArgC MSlow |
|
|---|
| LysN MSlow |
|
|---|
| TryLysC MSlow |
|
|---|
| Try MShigh |
|
|---|
| ChTry MShigh |
|
|---|
| ArgC MShigh |
|
|---|
| LysN MShigh |
|
|---|
| TryLysC MShigh |
|
|---|
General Statistics
Number of major isoforms |
Number of additional isoforms |
Number of all proteins |
Number of amino acids |
Min. Seq. Length |
Max. Seq. Length |
Avg. Seq. Length |
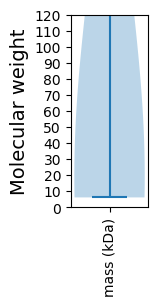
Avg. Mol. Weight |
|---|---|---|---|---|---|---|---|
0 |
13107 |
53 |
6510 |
819.2 |
91.64 |
Amino acid frequency
Ala |
Cys |
Asp |
Glu |
Phe |
Gly |
His |
Ile |
Lys |
Leu |
|---|---|---|---|---|---|---|---|---|---|
6.905 ± 0.538 | 3.449 ± 0.212 |
5.547 ± 0.274 | 3.716 ± 0.254 |
5.936 ± 0.269 | 6.058 ± 0.323 |
1.747 ± 0.207 | 4.738 ± 0.323 |
5.325 ± 0.398 | 9.163 ± 0.409 |
Met |
Asn |
Gln |
Pro |
Arg |
Ser |
Thr |
Val |
Trp |
Tyr |
|---|---|---|---|---|---|---|---|---|---|
1.915 ± 0.104 | 5.562 ± 0.218 |
3.7 ± 0.367 | 3.441 ± 0.587 |
3.464 ± 0.526 | 6.798 ± 0.325 |
5.638 ± 0.519 | 10.513 ± 0.933 |
1.381 ± 0.078 | 5.005 ± 0.39 |
Most of the basic statistics you can see at this page can be downloaded from this CSV file
See this proteome in:

Proteome-pI is available under Creative Commons Attribution-NoDerivs license, for more details see here
| Reference: Kozlowski LP. Proteome-pI 2.0: Proteome Isoelectric Point Database Update. Nucleic Acids Res. 2021, doi: 10.1093/nar/gkab944 | Contact: Lukasz P. Kozlowski |