Candidatus Gastranaerophilus sp. (ex Termes propinquus)
Taxonomy: cellular organisms; Bacteria; Terrabacteria group; Cyanobacteria/Melainabacteria group; Candidatus Melainabacteria; Candidatus Gastranaerophilales; Candidatus Gastranaerophilus
Average proteome isoelectric point is 6.56
Get precalculated fractions of proteins
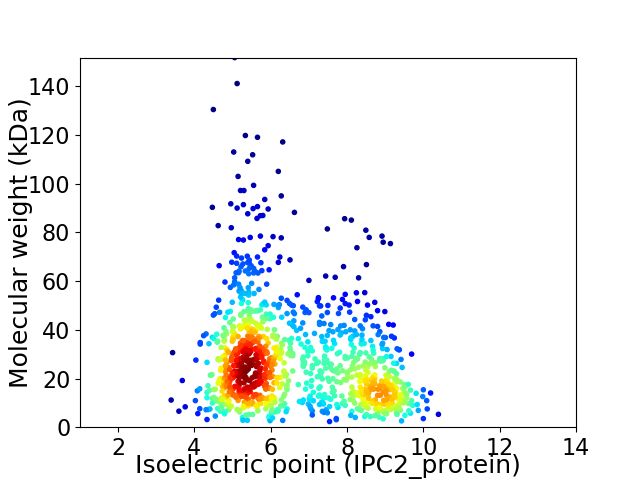
Virtual 2D-PAGE plot for 1073 proteins (isoelectric point calculated using IPC2_protein)
Get csv file with sequences according to given criteria:
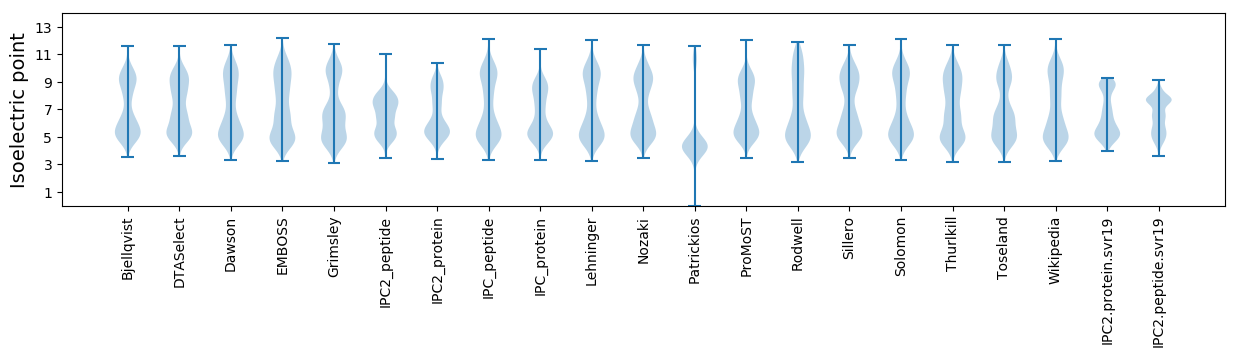
* You can choose from 21 different methods for calculating isoelectric point
Summary statistics related to proteome-wise predictions
Protein with the lowest isoelectric point:
>tr|A0A2L2X4V3|A0A2L2X4V3_9BACT Ribosomal-protein-alanine N-acetyltransferase OS=Candidatus Gastranaerophilus sp. (ex Termes propinquus) OX=2029980 GN=rimI PE=4 SV=1
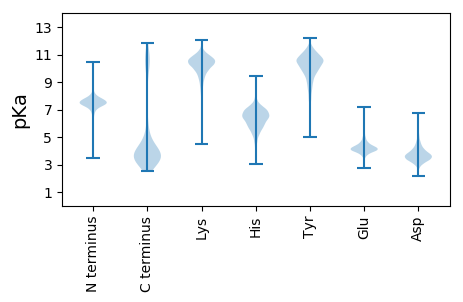
MM1 pKa = 7.61EE2 pKa = 5.9KK3 pKa = 10.45YY4 pKa = 9.53VCQVCGYY11 pKa = 10.57VYY13 pKa = 10.47DD14 pKa = 4.2PQEE17 pKa = 4.27GDD19 pKa = 3.58SVGGVAPGTPFDD31 pKa = 4.82AVPADD36 pKa = 3.72WTCPVCGVGKK46 pKa = 10.01DD47 pKa = 3.6QFAKK51 pKa = 10.25QAA53 pKa = 3.43
MM1 pKa = 7.61EE2 pKa = 5.9KK3 pKa = 10.45YY4 pKa = 9.53VCQVCGYY11 pKa = 10.57VYY13 pKa = 10.47DD14 pKa = 4.2PQEE17 pKa = 4.27GDD19 pKa = 3.58SVGGVAPGTPFDD31 pKa = 4.82AVPADD36 pKa = 3.72WTCPVCGVGKK46 pKa = 10.01DD47 pKa = 3.6QFAKK51 pKa = 10.25QAA53 pKa = 3.43
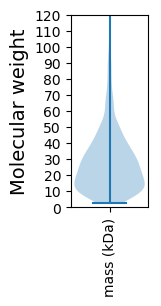
Molecular weight: 5.59 kDa
Isoelectric point according different methods:
Protein with the highest isoelectric point:
>tr|A0A2L2X6P3|A0A2L2X6P3_9BACT Putative secondary thiamine-phosphate synthase enzyme OS=Candidatus Gastranaerophilus sp. (ex Termes propinquus) OX=2029980 GN=tpqmel_1011 PE=3 SV=1
EEE2 pKa = 4.3YY3 pKa = 10.95LGIAIRR9 pKa = 11.84NAVVATRR16 pKa = 11.84AIGFVKKK23 pKa = 10.59LVAARR28 pKa = 11.84LLIVL
EEE2 pKa = 4.3YY3 pKa = 10.95LGIAIRR9 pKa = 11.84NAVVATRR16 pKa = 11.84AIGFVKKK23 pKa = 10.59LVAARR28 pKa = 11.84LLIVL
Molecular weight: 3.53 kDa
Isoelectric point according different methods:
Peptides (in silico digests for buttom-up proteomics)
Below you can find in silico digests of the whole proteome with Trypsin, Chymotrypsin, Trypsin+LysC, LysN, ArgC proteases suitable for different mass spec machines.| Try ESI |
 |
|---|
| ChTry ESI |
|
|---|
| ArgC ESI |
|
|---|
| LysN ESI |
|
|---|
| TryLysC ESI |
|
|---|
| Try MALDI |
|
|---|
| ChTry MALDI |
|
|---|
| ArgC MALDI |
|
|---|
| LysN MALDI |
|
|---|
| TryLysC MALDI |
|
|---|
| Try LTQ |
|
|---|
| ChTry LTQ |
|
|---|
| ArgC LTQ |
|
|---|
| LysN LTQ |
|
|---|
| TryLysC LTQ |
|
|---|
| Try MSlow |
|
|---|
| ChTry MSlow |
|
|---|
| ArgC MSlow |
|
|---|
| LysN MSlow |
|
|---|
| TryLysC MSlow |
|
|---|
| Try MShigh |
|
|---|
| ChTry MShigh |
|
|---|
| ArgC MShigh |
|
|---|
| LysN MShigh |
|
|---|
| TryLysC MShigh |
|
|---|
General Statistics
Number of major isoforms |
Number of additional isoforms |
Number of all proteins |
Number of amino acids |
Min. Seq. Length |
Max. Seq. Length |
Avg. Seq. Length |
Avg. Mol. Weight |
|---|---|---|---|---|---|---|---|
0 |
278237 |
19 |
1365 |
259.3 |
28.92 |
Amino acid frequency
Ala |
Cys |
Asp |
Glu |
Phe |
Gly |
His |
Ile |
Lys |
Leu |
|---|---|---|---|---|---|---|---|---|---|
8.003 ± 0.077 | 1.331 ± 0.032 |
5.398 ± 0.051 | 7.421 ± 0.084 |
4.405 ± 0.052 | 6.481 ± 0.082 |
1.652 ± 0.036 | 7.269 ± 0.068 |
8.228 ± 0.071 | 9.455 ± 0.078 |
Met |
Asn |
Gln |
Pro |
Arg |
Ser |
Thr |
Val |
Trp |
Tyr |
|---|---|---|---|---|---|---|---|---|---|
2.352 ± 0.038 | 4.961 ± 0.067 |
3.436 ± 0.049 | 3.27 ± 0.046 |
3.974 ± 0.056 | 6.37 ± 0.069 |
5.283 ± 0.067 | 6.737 ± 0.065 |
0.64 ± 0.02 | 3.336 ± 0.05 |
Most of the basic statistics you can see at this page can be downloaded from this CSV file
See this proteome in:

Proteome-pI is available under Creative Commons Attribution-NoDerivs license, for more details see here
| Reference: Kozlowski LP. Proteome-pI 2.0: Proteome Isoelectric Point Database Update. Nucleic Acids Res. 2021, doi: 10.1093/nar/gkab944 | Contact: Lukasz P. Kozlowski |