Frondihabitans australicus
Taxonomy: cellular organisms; Bacteria; Terrabacteria group; Actinobacteria; Actinomycetia; Micrococcales; Microbacteriaceae; Frondihabitans
Average proteome isoelectric point is 6.13
Get precalculated fractions of proteins
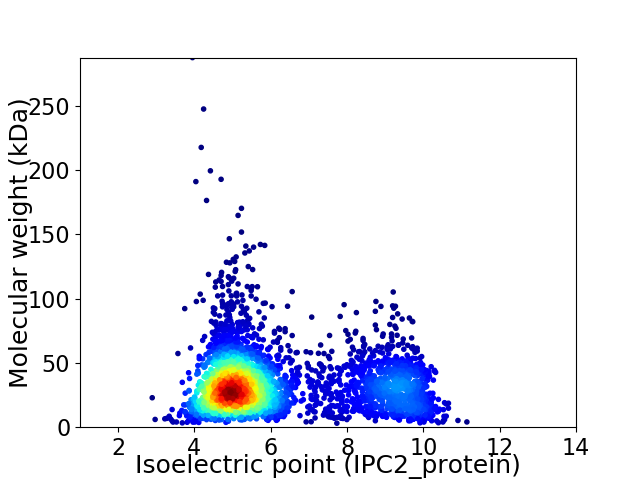
Virtual 2D-PAGE plot for 3787 proteins (isoelectric point calculated using IPC2_protein)
Get csv file with sequences according to given criteria:
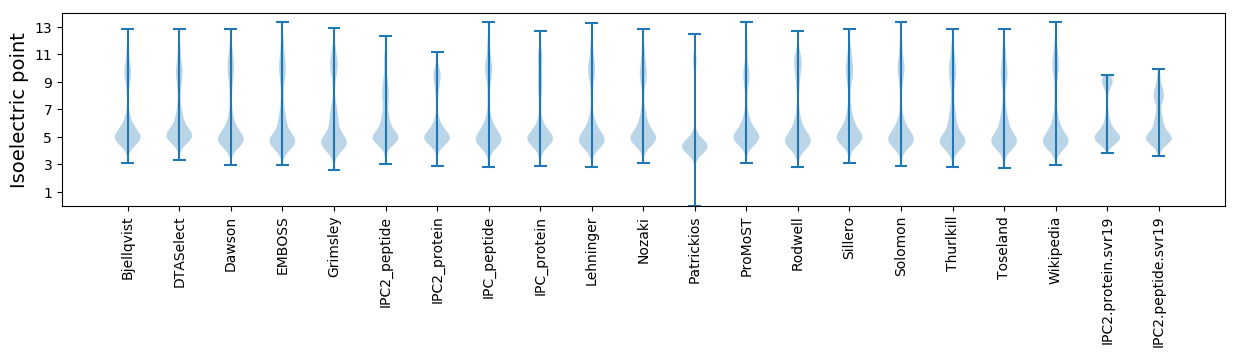
* You can choose from 21 different methods for calculating isoelectric point
Summary statistics related to proteome-wise predictions
Protein with the lowest isoelectric point:
>tr|A0A495IHG7|A0A495IHG7_9MICO Citrate synthase OS=Frondihabitans australicus OX=386892 GN=C8E83_2032 PE=3 SV=1
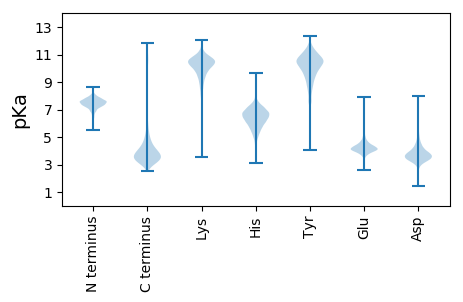
MM1 pKa = 7.46NPTTALGPTEE11 pKa = 4.39PEE13 pKa = 3.42HH14 pKa = 6.93RR15 pKa = 11.84PYY17 pKa = 11.39YY18 pKa = 10.75DD19 pKa = 5.09LDD21 pKa = 4.68LVDD24 pKa = 5.67CDD26 pKa = 4.0WDD28 pKa = 3.87DD29 pKa = 3.29
MM1 pKa = 7.46NPTTALGPTEE11 pKa = 4.39PEE13 pKa = 3.42HH14 pKa = 6.93RR15 pKa = 11.84PYY17 pKa = 11.39YY18 pKa = 10.75DD19 pKa = 5.09LDD21 pKa = 4.68LVDD24 pKa = 5.67CDD26 pKa = 4.0WDD28 pKa = 3.87DD29 pKa = 3.29
Molecular weight: 3.38 kDa
Isoelectric point according different methods:
Protein with the highest isoelectric point:
>tr|A0A495ICS5|A0A495ICS5_9MICO Cell division protein FtsX OS=Frondihabitans australicus OX=386892 GN=C8E83_0814 PE=3 SV=1
MM1 pKa = 7.4GSVIKK6 pKa = 10.42KK7 pKa = 8.47RR8 pKa = 11.84RR9 pKa = 11.84KK10 pKa = 9.22RR11 pKa = 11.84MAKK14 pKa = 9.41KK15 pKa = 9.87KK16 pKa = 9.7HH17 pKa = 5.84RR18 pKa = 11.84KK19 pKa = 8.56LLRR22 pKa = 11.84KK23 pKa = 7.78TRR25 pKa = 11.84HH26 pKa = 3.65QRR28 pKa = 11.84RR29 pKa = 11.84NKK31 pKa = 9.78KK32 pKa = 9.85
MM1 pKa = 7.4GSVIKK6 pKa = 10.42KK7 pKa = 8.47RR8 pKa = 11.84RR9 pKa = 11.84KK10 pKa = 9.22RR11 pKa = 11.84MAKK14 pKa = 9.41KK15 pKa = 9.87KK16 pKa = 9.7HH17 pKa = 5.84RR18 pKa = 11.84KK19 pKa = 8.56LLRR22 pKa = 11.84KK23 pKa = 7.78TRR25 pKa = 11.84HH26 pKa = 3.65QRR28 pKa = 11.84RR29 pKa = 11.84NKK31 pKa = 9.78KK32 pKa = 9.85
Molecular weight: 4.08 kDa
Isoelectric point according different methods:
Peptides (in silico digests for buttom-up proteomics)
Below you can find in silico digests of the whole proteome with Trypsin, Chymotrypsin, Trypsin+LysC, LysN, ArgC proteases suitable for different mass spec machines.| Try ESI |
 |
|---|
| ChTry ESI |
|
|---|
| ArgC ESI |
|
|---|
| LysN ESI |
|
|---|
| TryLysC ESI |
|
|---|
| Try MALDI |
|
|---|
| ChTry MALDI |
|
|---|
| ArgC MALDI |
|
|---|
| LysN MALDI |
|
|---|
| TryLysC MALDI |
|
|---|
| Try LTQ |
|
|---|
| ChTry LTQ |
|
|---|
| ArgC LTQ |
|
|---|
| LysN LTQ |
|
|---|
| TryLysC LTQ |
|
|---|
| Try MSlow |
|
|---|
| ChTry MSlow |
|
|---|
| ArgC MSlow |
|
|---|
| LysN MSlow |
|
|---|
| TryLysC MSlow |
|
|---|
| Try MShigh |
|
|---|
| ChTry MShigh |
|
|---|
| ArgC MShigh |
|
|---|
| LysN MShigh |
|
|---|
| TryLysC MShigh |
|
|---|
General Statistics
Number of major isoforms |
Number of additional isoforms |
Number of all proteins |
Number of amino acids |
Min. Seq. Length |
Max. Seq. Length |
Avg. Seq. Length |
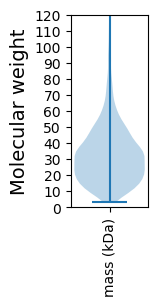
Avg. Mol. Weight |
|---|---|---|---|---|---|---|---|
0 |
1213946 |
29 |
2988 |
320.6 |
34.13 |
Amino acid frequency
Ala |
Cys |
Asp |
Glu |
Phe |
Gly |
His |
Ile |
Lys |
Leu |
|---|---|---|---|---|---|---|---|---|---|
13.341 ± 0.051 | 0.473 ± 0.008 |
6.149 ± 0.038 | 5.065 ± 0.047 |
3.199 ± 0.029 | 9.061 ± 0.039 |
1.955 ± 0.018 | 4.303 ± 0.027 |
2.086 ± 0.031 | 9.943 ± 0.049 |
Met |
Asn |
Gln |
Pro |
Arg |
Ser |
Thr |
Val |
Trp |
Tyr |
|---|---|---|---|---|---|---|---|---|---|
1.679 ± 0.017 | 2.004 ± 0.026 |
5.379 ± 0.029 | 2.784 ± 0.024 |
6.963 ± 0.06 | 6.459 ± 0.043 |
6.643 ± 0.067 | 9.037 ± 0.033 |
1.44 ± 0.019 | 2.038 ± 0.018 |
Most of the basic statistics you can see at this page can be downloaded from this CSV file
See this proteome in:

Proteome-pI is available under Creative Commons Attribution-NoDerivs license, for more details see here
| Reference: Kozlowski LP. Proteome-pI 2.0: Proteome Isoelectric Point Database Update. Nucleic Acids Res. 2021, doi: 10.1093/nar/gkab944 | Contact: Lukasz P. Kozlowski |