Capybara microvirus Cap3_SP_437
Taxonomy: Viruses; Monodnaviria; Sangervirae; Phixviricota; Malgrandaviricetes; Petitvirales; Microviridae; unclassified Microviridae
Average proteome isoelectric point is 6.63
Get precalculated fractions of proteins
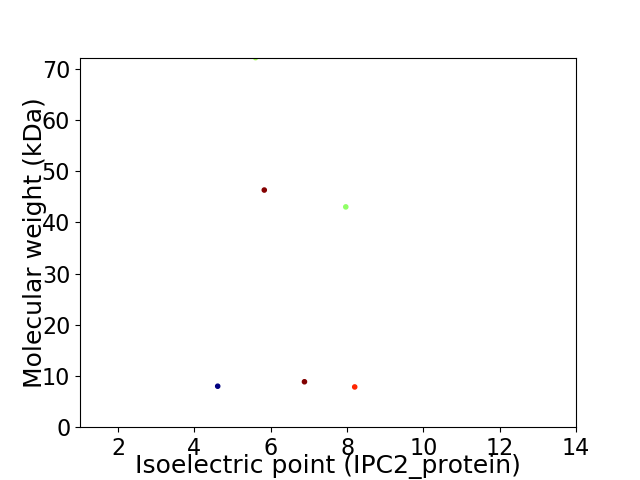
Virtual 2D-PAGE plot for 6 proteins (isoelectric point calculated using IPC2_protein)
Get csv file with sequences according to given criteria:
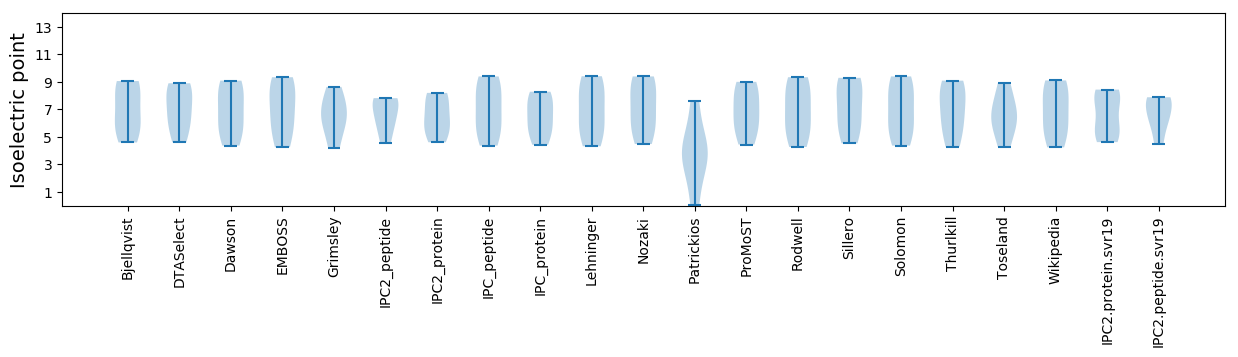
* You can choose from 21 different methods for calculating isoelectric point
Summary statistics related to proteome-wise predictions
Protein with the lowest isoelectric point:
>tr|A0A4P8W501|A0A4P8W501_9VIRU Uncharacterized protein OS=Capybara microvirus Cap3_SP_437 OX=2585452 PE=4 SV=1
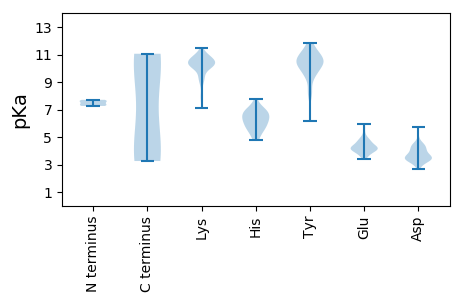
MM1 pKa = 7.26KK2 pKa = 10.23VYY4 pKa = 10.79EE5 pKa = 4.48GFEE8 pKa = 4.5KK9 pKa = 10.56INSFRR14 pKa = 11.84IVAIPDD20 pKa = 3.46TKK22 pKa = 10.77RR23 pKa = 11.84LFEE26 pKa = 5.7LYY28 pKa = 9.77RR29 pKa = 11.84QSPNLVGNEE38 pKa = 4.43DD39 pKa = 3.6EE40 pKa = 5.07TIDD43 pKa = 4.56LALEE47 pKa = 4.21SAQRR51 pKa = 11.84PTDD54 pKa = 3.44SMALYY59 pKa = 9.47EE60 pKa = 4.52LYY62 pKa = 10.62SRR64 pKa = 11.84SIDD67 pKa = 3.75SEE69 pKa = 4.3
MM1 pKa = 7.26KK2 pKa = 10.23VYY4 pKa = 10.79EE5 pKa = 4.48GFEE8 pKa = 4.5KK9 pKa = 10.56INSFRR14 pKa = 11.84IVAIPDD20 pKa = 3.46TKK22 pKa = 10.77RR23 pKa = 11.84LFEE26 pKa = 5.7LYY28 pKa = 9.77RR29 pKa = 11.84QSPNLVGNEE38 pKa = 4.43DD39 pKa = 3.6EE40 pKa = 5.07TIDD43 pKa = 4.56LALEE47 pKa = 4.21SAQRR51 pKa = 11.84PTDD54 pKa = 3.44SMALYY59 pKa = 9.47EE60 pKa = 4.52LYY62 pKa = 10.62SRR64 pKa = 11.84SIDD67 pKa = 3.75SEE69 pKa = 4.3
Molecular weight: 8.0 kDa
Isoelectric point according different methods:
Protein with the highest isoelectric point:
>tr|A0A4P8W542|A0A4P8W542_9VIRU Uncharacterized protein OS=Capybara microvirus Cap3_SP_437 OX=2585452 PE=4 SV=1
MM1 pKa = 7.64KK2 pKa = 10.14EE3 pKa = 3.95STKK6 pKa = 10.33TALKK10 pKa = 10.26EE11 pKa = 3.56LAKK14 pKa = 10.75CILTALIAFITAILSSSCGTTRR36 pKa = 11.84AVVTNKK42 pKa = 10.22AEE44 pKa = 4.09QTNTEE49 pKa = 3.99IKK51 pKa = 9.3ITTNNPSTISVDD63 pKa = 3.32PNTTIDD69 pKa = 3.97LYY71 pKa = 11.48KK72 pKa = 10.56KK73 pKa = 10.55
MM1 pKa = 7.64KK2 pKa = 10.14EE3 pKa = 3.95STKK6 pKa = 10.33TALKK10 pKa = 10.26EE11 pKa = 3.56LAKK14 pKa = 10.75CILTALIAFITAILSSSCGTTRR36 pKa = 11.84AVVTNKK42 pKa = 10.22AEE44 pKa = 4.09QTNTEE49 pKa = 3.99IKK51 pKa = 9.3ITTNNPSTISVDD63 pKa = 3.32PNTTIDD69 pKa = 3.97LYY71 pKa = 11.48KK72 pKa = 10.56KK73 pKa = 10.55
Molecular weight: 7.86 kDa
Isoelectric point according different methods:
Peptides (in silico digests for buttom-up proteomics)
Below you can find in silico digests of the whole proteome with Trypsin, Chymotrypsin, Trypsin+LysC, LysN, ArgC proteases suitable for different mass spec machines.| Try ESI |
 |
|---|
| ChTry ESI |
|
|---|
| ArgC ESI |
|
|---|
| LysN ESI |
|
|---|
| TryLysC ESI |
|
|---|
| Try MALDI |
|
|---|
| ChTry MALDI |
|
|---|
| ArgC MALDI |
|
|---|
| LysN MALDI |
|
|---|
| TryLysC MALDI |
|
|---|
| Try LTQ |
|
|---|
| ChTry LTQ |
|
|---|
| ArgC LTQ |
|
|---|
| LysN LTQ |
|
|---|
| TryLysC LTQ |
|
|---|
| Try MSlow |
|
|---|
| ChTry MSlow |
|
|---|
| ArgC MSlow |
|
|---|
| LysN MSlow |
|
|---|
| TryLysC MSlow |
|
|---|
| Try MShigh |
|
|---|
| ChTry MShigh |
|
|---|
| ArgC MShigh |
|
|---|
| LysN MShigh |
|
|---|
| TryLysC MShigh |
|
|---|
General Statistics
Number of major isoforms |
Number of additional isoforms |
Number of all proteins |
Number of amino acids |
Min. Seq. Length |
Max. Seq. Length |
Avg. Seq. Length |
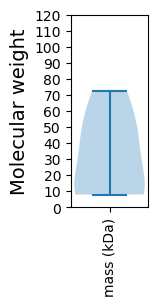
Avg. Mol. Weight |
|---|---|---|---|---|---|---|---|
0 |
1626 |
69 |
635 |
271.0 |
31.04 |
Amino acid frequency
Ala |
Cys |
Asp |
Glu |
Phe |
Gly |
His |
Ile |
Lys |
Leu |
|---|---|---|---|---|---|---|---|---|---|
6.273 ± 1.484 | 1.415 ± 0.62 |
6.027 ± 0.605 | 5.351 ± 1.082 |
3.875 ± 1.086 | 4.121 ± 0.473 |
2.276 ± 0.747 | 6.581 ± 0.737 |
6.335 ± 1.464 | 7.688 ± 0.461 |
Met |
Asn |
Gln |
Pro |
Arg |
Ser |
Thr |
Val |
Trp |
Tyr |
|---|---|---|---|---|---|---|---|---|---|
2.46 ± 0.337 | 8.18 ± 0.433 |
4.059 ± 0.653 | 4.182 ± 0.683 |
4.736 ± 0.403 | 9.102 ± 1.354 |
5.351 ± 1.494 | 4.736 ± 0.77 |
0.677 ± 0.28 | 6.581 ± 0.903 |
Most of the basic statistics you can see at this page can be downloaded from this CSV file
See this proteome in:

Proteome-pI is available under Creative Commons Attribution-NoDerivs license, for more details see here
| Reference: Kozlowski LP. Proteome-pI 2.0: Proteome Isoelectric Point Database Update. Nucleic Acids Res. 2021, doi: 10.1093/nar/gkab944 | Contact: Lukasz P. Kozlowski |