Severe acute respiratory syndrome coronavirus 2 (2019-nCoV) (SARS-CoV-2)
Taxonomy: Viruses; Riboviria; Orthornavirae; Pisuviricota; Pisoniviricetes; Nidovirales; Cornidovirineae; Coronaviridae; Orthocoronavirinae; Betacoronavirus; Sarbecovirus; Severe acute respiratory syndrome-related coronavirus
Average proteome isoelectric point is 6.69
Get precalculated fractions of proteins
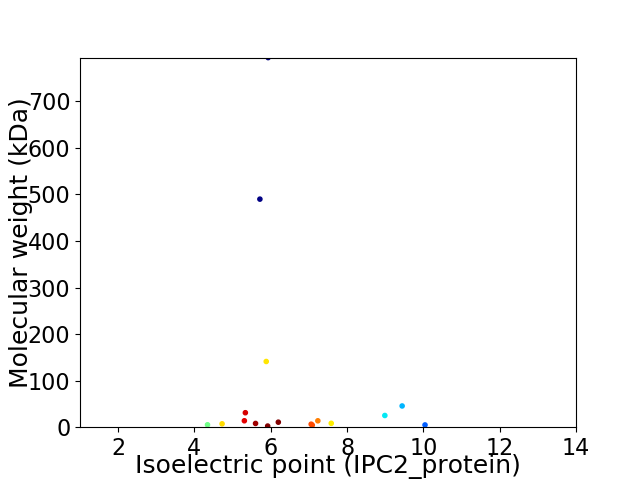
Virtual 2D-PAGE plot for 17 proteins (isoelectric point calculated using IPC2_protein)
Get csv file with sequences according to given criteria:
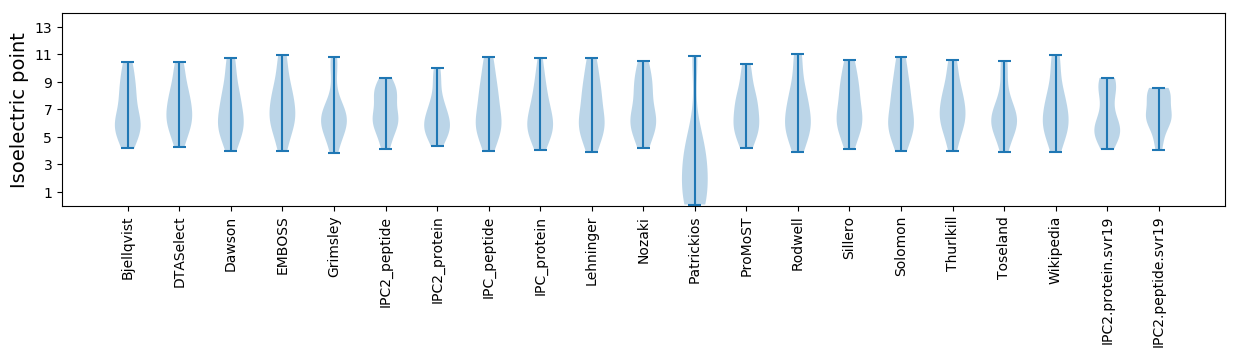
* You can choose from 21 different methods for calculating isoelectric point
Summary statistics related to proteome-wise predictions
Protein with the lowest isoelectric point:
>sp|P0DTF1|ORF3B_SARS2 ORF3b protein OS=Severe acute respiratory syndrome coronavirus 2 OX=2697049 PE=4 SV=1
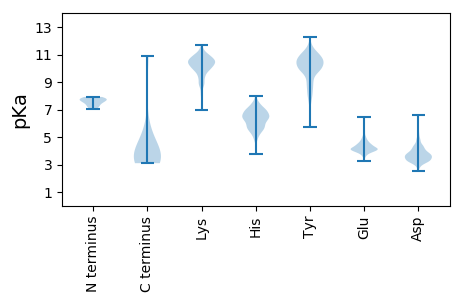
MM1 pKa = 7.74IEE3 pKa = 4.11LSLIDD8 pKa = 5.32FYY10 pKa = 11.8LCFLAFLLFLVLIMLIIFWFSLEE33 pKa = 4.11LQDD36 pKa = 5.82HH37 pKa = 6.7NEE39 pKa = 4.02TCHH42 pKa = 6.32AA43 pKa = 4.65
MM1 pKa = 7.74IEE3 pKa = 4.11LSLIDD8 pKa = 5.32FYY10 pKa = 11.8LCFLAFLLFLVLIMLIIFWFSLEE33 pKa = 4.11LQDD36 pKa = 5.82HH37 pKa = 6.7NEE39 pKa = 4.02TCHH42 pKa = 6.32AA43 pKa = 4.65
Molecular weight: 5.18 kDa
Isoelectric point according different methods:
Protein with the highest isoelectric point:
>sp|P0DTG1|ORF3C_SARS2 ORF3c protein OS=Severe acute respiratory syndrome coronavirus 2 OX=2697049 PE=4 SV=1
MM1 pKa = 7.75LLLQILFALLQRR13 pKa = 11.84YY14 pKa = 8.85RR15 pKa = 11.84YY16 pKa = 9.05KK17 pKa = 10.6PHH19 pKa = 6.59SLSDD23 pKa = 3.61GLLLALHH30 pKa = 6.61FLLFFRR36 pKa = 11.84ALPKK40 pKa = 10.51SS41 pKa = 3.56
MM1 pKa = 7.75LLLQILFALLQRR13 pKa = 11.84YY14 pKa = 8.85RR15 pKa = 11.84YY16 pKa = 9.05KK17 pKa = 10.6PHH19 pKa = 6.59SLSDD23 pKa = 3.61GLLLALHH30 pKa = 6.61FLLFFRR36 pKa = 11.84ALPKK40 pKa = 10.51SS41 pKa = 3.56
Molecular weight: 4.86 kDa
Isoelectric point according different methods:
Peptides (in silico digests for buttom-up proteomics)
Below you can find in silico digests of the whole proteome with Trypsin, Chymotrypsin, Trypsin+LysC, LysN, ArgC proteases suitable for different mass spec machines.| Try ESI |
 |
|---|
| ChTry ESI |
|
|---|
| ArgC ESI |
|
|---|
| LysN ESI |
|
|---|
| TryLysC ESI |
|
|---|
| Try MALDI |
|
|---|
| ChTry MALDI |
|
|---|
| ArgC MALDI |
|
|---|
| LysN MALDI |
|
|---|
| TryLysC MALDI |
|
|---|
| Try LTQ |
|
|---|
| ChTry LTQ |
|
|---|
| ArgC LTQ |
|
|---|
| LysN LTQ |
|
|---|
| TryLysC LTQ |
|
|---|
| Try MSlow |
|
|---|
| ChTry MSlow |
|
|---|
| ArgC MSlow |
|
|---|
| LysN MSlow |
|
|---|
| TryLysC MSlow |
|
|---|
| Try MShigh |
|
|---|
| ChTry MShigh |
|
|---|
| ArgC MShigh |
|
|---|
| LysN MShigh |
|
|---|
| TryLysC MShigh |
|
|---|
General Statistics
Number of major isoforms |
Number of additional isoforms |
Number of all proteins |
Number of amino acids |
Min. Seq. Length |
Max. Seq. Length |
Avg. Seq. Length |
Avg. Mol. Weight |
|---|---|---|---|---|---|---|---|
0 |
14439 |
22 |
7096 |
849.4 |
94.86 |
Amino acid frequency
Ala |
Cys |
Asp |
Glu |
Phe |
Gly |
His |
Ile |
Lys |
Leu |
|---|---|---|---|---|---|---|---|---|---|
6.863 ± 0.261 | 3.103 ± 0.253 |
5.049 ± 0.359 | 4.806 ± 0.357 |
4.986 ± 0.288 | 5.873 ± 0.32 |
1.877 ± 0.151 | 5.125 ± 0.401 |
5.894 ± 0.416 | 9.793 ± 0.657 |
Met |
Asn |
Gln |
Pro |
Arg |
Ser |
Thr |
Val |
Trp |
Tyr |
|---|---|---|---|---|---|---|---|---|---|
2.251 ± 0.227 | 5.36 ± 0.288 |
3.975 ± 0.3 | 3.698 ± 0.53 |
3.407 ± 0.375 | 6.711 ± 0.323 |
7.487 ± 0.259 | 8.138 ± 0.577 |
1.108 ± 0.114 | 4.495 ± 0.264 |
Most of the basic statistics you can see at this page can be downloaded from this CSV file
See this proteome in:

Proteome-pI is available under Creative Commons Attribution-NoDerivs license, for more details see here
| Reference: Kozlowski LP. Proteome-pI 2.0: Proteome Isoelectric Point Database Update. Nucleic Acids Res. 2021, doi: 10.1093/nar/gkab944 | Contact: Lukasz P. Kozlowski |