Thermoflexus hugenholtzii JAD2
Taxonomy: cellular organisms; Bacteria; Terrabacteria group; Chloroflexi; Thermoflexia; Thermoflexales; Thermoflexaceae; Thermoflexus; Thermoflexus hugenholtzii
Average proteome isoelectric point is 6.91
Get precalculated fractions of proteins
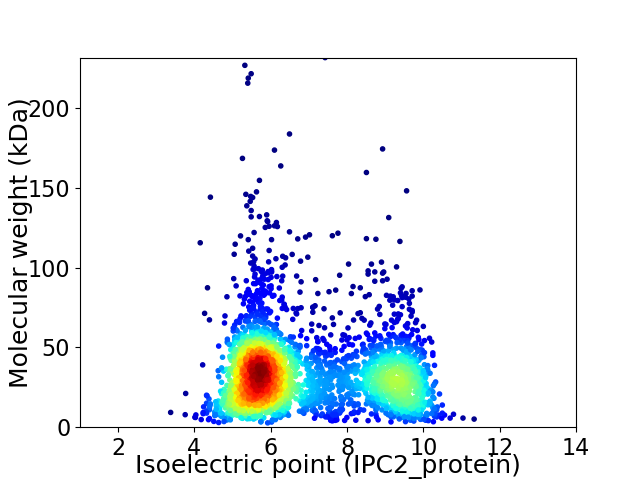
Virtual 2D-PAGE plot for 2944 proteins (isoelectric point calculated using IPC2_protein)
Get csv file with sequences according to given criteria:
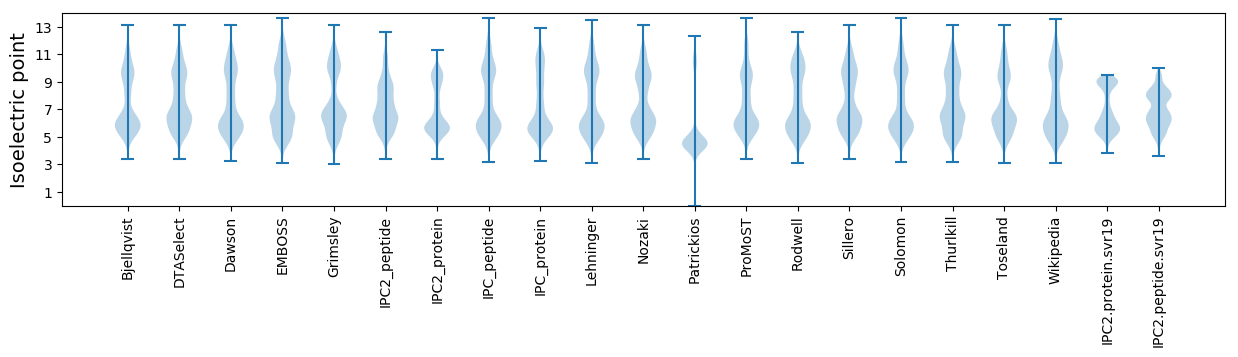
* You can choose from 21 different methods for calculating isoelectric point
Summary statistics related to proteome-wise predictions
Protein with the lowest isoelectric point:
>tr|A0A212RL63|A0A212RL63_9CHLR Glyoxalase family protein OS=Thermoflexus hugenholtzii JAD2 OX=877466 GN=SAMN02746019_00017180 PE=4 SV=1
MM1 pKa = 7.18SQAICPEE8 pKa = 4.21CAAGVPLRR16 pKa = 11.84EE17 pKa = 3.91DD18 pKa = 3.48VMLHH22 pKa = 6.2EE23 pKa = 5.51FLTCPEE29 pKa = 4.81CGTALEE35 pKa = 4.52VVSLSPLTLDD45 pKa = 3.87RR46 pKa = 11.84APQVEE51 pKa = 4.6EE52 pKa = 4.15DD53 pKa = 3.18WGEE56 pKa = 3.71
MM1 pKa = 7.18SQAICPEE8 pKa = 4.21CAAGVPLRR16 pKa = 11.84EE17 pKa = 3.91DD18 pKa = 3.48VMLHH22 pKa = 6.2EE23 pKa = 5.51FLTCPEE29 pKa = 4.81CGTALEE35 pKa = 4.52VVSLSPLTLDD45 pKa = 3.87RR46 pKa = 11.84APQVEE51 pKa = 4.6EE52 pKa = 4.15DD53 pKa = 3.18WGEE56 pKa = 3.71
Molecular weight: 6.09 kDa
Isoelectric point according different methods:
Protein with the highest isoelectric point:
>tr|A0A212RJZ2|A0A212RJZ2_9CHLR 2-alkenal reductase OS=Thermoflexus hugenholtzii JAD2 OX=877466 GN=SAMN02746019_00016390 PE=4 SV=1
PP1 pKa = 7.11GLSRR5 pKa = 11.84GNRR8 pKa = 11.84PPLRR12 pKa = 11.84RR13 pKa = 11.84TRR15 pKa = 11.84RR16 pKa = 11.84SPAPTLRR23 pKa = 11.84RR24 pKa = 11.84VRR26 pKa = 11.84RR27 pKa = 11.84PPPGVPGLSRR37 pKa = 11.84GNRR40 pKa = 11.84PPLRR44 pKa = 11.84RR45 pKa = 3.6
PP1 pKa = 7.11GLSRR5 pKa = 11.84GNRR8 pKa = 11.84PPLRR12 pKa = 11.84RR13 pKa = 11.84TRR15 pKa = 11.84RR16 pKa = 11.84SPAPTLRR23 pKa = 11.84RR24 pKa = 11.84VRR26 pKa = 11.84RR27 pKa = 11.84PPPGVPGLSRR37 pKa = 11.84GNRR40 pKa = 11.84PPLRR44 pKa = 11.84RR45 pKa = 3.6
Molecular weight: 5.08 kDa
Isoelectric point according different methods:
Peptides (in silico digests for buttom-up proteomics)
Below you can find in silico digests of the whole proteome with Trypsin, Chymotrypsin, Trypsin+LysC, LysN, ArgC proteases suitable for different mass spec machines.| Try ESI |
 |
|---|
| ChTry ESI |
|
|---|
| ArgC ESI |
|
|---|
| LysN ESI |
|
|---|
| TryLysC ESI |
|
|---|
| Try MALDI |
|
|---|
| ChTry MALDI |
|
|---|
| ArgC MALDI |
|
|---|
| LysN MALDI |
|
|---|
| TryLysC MALDI |
|
|---|
| Try LTQ |
|
|---|
| ChTry LTQ |
|
|---|
| ArgC LTQ |
|
|---|
| LysN LTQ |
|
|---|
| TryLysC LTQ |
|
|---|
| Try MSlow |
|
|---|
| ChTry MSlow |
|
|---|
| ArgC MSlow |
|
|---|
| LysN MSlow |
|
|---|
| TryLysC MSlow |
|
|---|
| Try MShigh |
|
|---|
| ChTry MShigh |
|
|---|
| ArgC MShigh |
|
|---|
| LysN MShigh |
|
|---|
| TryLysC MShigh |
|
|---|
General Statistics
Number of major isoforms |
Number of additional isoforms |
Number of all proteins |
Number of amino acids |
Min. Seq. Length |
Max. Seq. Length |
Avg. Seq. Length |
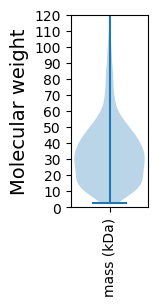
Avg. Mol. Weight |
|---|---|---|---|---|---|---|---|
0 |
955847 |
26 |
2049 |
324.7 |
35.92 |
Amino acid frequency
Ala |
Cys |
Asp |
Glu |
Phe |
Gly |
His |
Ile |
Lys |
Leu |
|---|---|---|---|---|---|---|---|---|---|
11.639 ± 0.055 | 0.74 ± 0.014 |
4.19 ± 0.031 | 7.171 ± 0.054 |
3.495 ± 0.028 | 8.538 ± 0.048 |
1.976 ± 0.018 | 4.975 ± 0.035 |
1.755 ± 0.034 | 11.968 ± 0.058 |
Met |
Asn |
Gln |
Pro |
Arg |
Ser |
Thr |
Val |
Trp |
Tyr |
|---|---|---|---|---|---|---|---|---|---|
2.152 ± 0.017 | 1.657 ± 0.022 |
6.992 ± 0.044 | 3.025 ± 0.027 |
9.44 ± 0.049 | 3.826 ± 0.025 |
4.436 ± 0.033 | 7.387 ± 0.039 |
2.109 ± 0.031 | 2.527 ± 0.025 |
Most of the basic statistics you can see at this page can be downloaded from this CSV file
See this proteome in:

Proteome-pI is available under Creative Commons Attribution-NoDerivs license, for more details see here
| Reference: Kozlowski LP. Proteome-pI 2.0: Proteome Isoelectric Point Database Update. Nucleic Acids Res. 2021, doi: 10.1093/nar/gkab944 | Contact: Lukasz P. Kozlowski |