Streptomyces phage Nesbitt
Taxonomy: Viruses; Duplodnaviria; Heunggongvirae; Uroviricota; Caudoviricetes; Caudovirales; Siphoviridae; Abbeymikolonvirus; unclassified Abbeymikolonvirus
Average proteome isoelectric point is 6.54
Get precalculated fractions of proteins
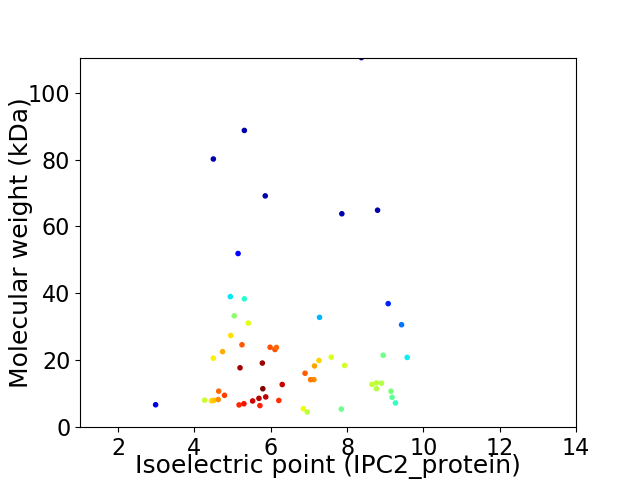
Virtual 2D-PAGE plot for 58 proteins (isoelectric point calculated using IPC2_protein)
Get csv file with sequences according to given criteria:
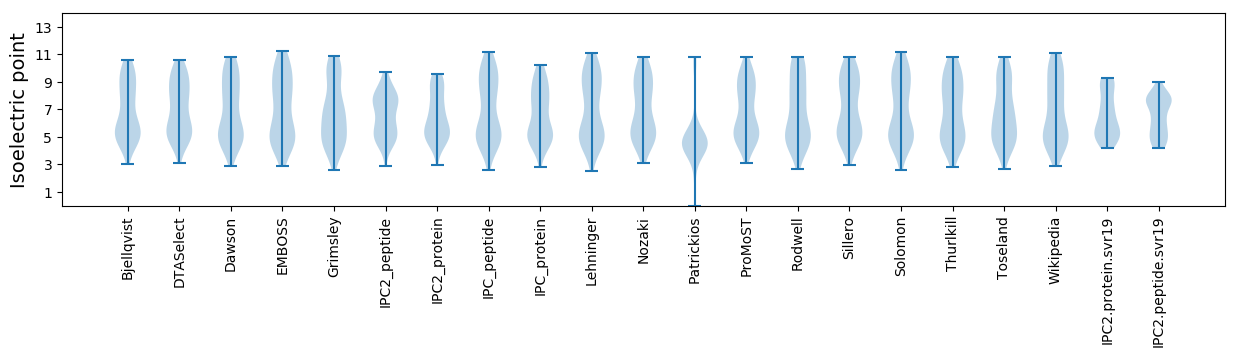
* You can choose from 21 different methods for calculating isoelectric point
Summary statistics related to proteome-wise predictions
Protein with the lowest isoelectric point:
>tr|A0A2P1JT29|A0A2P1JT29_9CAUD RNA polymerase sigma factor OS=Streptomyces phage Nesbitt OX=2108133 GN=43 PE=4 SV=1
MM1 pKa = 7.52RR2 pKa = 11.84TPITTTNYY10 pKa = 9.08FRR12 pKa = 11.84QGAAASAVMLAAMATLAGCDD32 pKa = 4.5DD33 pKa = 4.27GPEE36 pKa = 4.16CLDD39 pKa = 3.66YY40 pKa = 10.01DD41 pKa = 4.16TQVVSTTSIVNGRR54 pKa = 11.84VVPGMTTVTVCTKK67 pKa = 10.06YY68 pKa = 10.75AEE70 pKa = 4.67PSTTPSEE77 pKa = 4.23
MM1 pKa = 7.52RR2 pKa = 11.84TPITTTNYY10 pKa = 9.08FRR12 pKa = 11.84QGAAASAVMLAAMATLAGCDD32 pKa = 4.5DD33 pKa = 4.27GPEE36 pKa = 4.16CLDD39 pKa = 3.66YY40 pKa = 10.01DD41 pKa = 4.16TQVVSTTSIVNGRR54 pKa = 11.84VVPGMTTVTVCTKK67 pKa = 10.06YY68 pKa = 10.75AEE70 pKa = 4.67PSTTPSEE77 pKa = 4.23
Molecular weight: 8.04 kDa
Isoelectric point according different methods:
Protein with the highest isoelectric point:
>tr|A0A2P1JT11|A0A2P1JT11_9CAUD Uncharacterized protein OS=Streptomyces phage Nesbitt OX=2108133 GN=7 PE=4 SV=1
MM1 pKa = 7.89TDD3 pKa = 2.94NQRR6 pKa = 11.84RR7 pKa = 11.84TARR10 pKa = 11.84TVFQTAVTLAAAVPALVEE28 pKa = 4.07ASGLAQTSGAVVIALAVSGAVTRR51 pKa = 11.84IMALPVVDD59 pKa = 3.98QLLPGWLRR67 pKa = 11.84KK68 pKa = 8.45EE69 pKa = 4.01AA70 pKa = 3.94
MM1 pKa = 7.89TDD3 pKa = 2.94NQRR6 pKa = 11.84RR7 pKa = 11.84TARR10 pKa = 11.84TVFQTAVTLAAAVPALVEE28 pKa = 4.07ASGLAQTSGAVVIALAVSGAVTRR51 pKa = 11.84IMALPVVDD59 pKa = 3.98QLLPGWLRR67 pKa = 11.84KK68 pKa = 8.45EE69 pKa = 4.01AA70 pKa = 3.94
Molecular weight: 7.24 kDa
Isoelectric point according different methods:
Peptides (in silico digests for buttom-up proteomics)
Below you can find in silico digests of the whole proteome with Trypsin, Chymotrypsin, Trypsin+LysC, LysN, ArgC proteases suitable for different mass spec machines.| Try ESI |
 |
|---|
| ChTry ESI |
|
|---|
| ArgC ESI |
|
|---|
| LysN ESI |
|
|---|
| TryLysC ESI |
|
|---|
| Try MALDI |
|
|---|
| ChTry MALDI |
|
|---|
| ArgC MALDI |
|
|---|
| LysN MALDI |
|
|---|
| TryLysC MALDI |
|
|---|
| Try LTQ |
|
|---|
| ChTry LTQ |
|
|---|
| ArgC LTQ |
|
|---|
| LysN LTQ |
|
|---|
| TryLysC LTQ |
|
|---|
| Try MSlow |
|
|---|
| ChTry MSlow |
|
|---|
| ArgC MSlow |
|
|---|
| LysN MSlow |
|
|---|
| TryLysC MSlow |
|
|---|
| Try MShigh |
|
|---|
| ChTry MShigh |
|
|---|
| ArgC MShigh |
|
|---|
| LysN MShigh |
|
|---|
| TryLysC MShigh |
|
|---|
General Statistics
Number of major isoforms |
Number of additional isoforms |
Number of all proteins |
Number of amino acids |
Min. Seq. Length |
Max. Seq. Length |
Avg. Seq. Length |
Avg. Mol. Weight |
|---|---|---|---|---|---|---|---|
0 |
12530 |
43 |
1045 |
216.0 |
23.61 |
Amino acid frequency
Ala |
Cys |
Asp |
Glu |
Phe |
Gly |
His |
Ile |
Lys |
Leu |
|---|---|---|---|---|---|---|---|---|---|
11.548 ± 0.363 | 0.766 ± 0.115 |
6.225 ± 0.234 | 6.457 ± 0.37 |
2.785 ± 0.184 | 8.835 ± 0.381 |
1.636 ± 0.197 | 3.432 ± 0.183 |
4.413 ± 0.406 | 8.5 ± 0.24 |
Met |
Asn |
Gln |
Pro |
Arg |
Ser |
Thr |
Val |
Trp |
Tyr |
|---|---|---|---|---|---|---|---|---|---|
2.37 ± 0.12 | 2.57 ± 0.154 |
5.235 ± 0.237 | 2.817 ± 0.162 |
7.63 ± 0.431 | 5.227 ± 0.24 |
6.927 ± 0.341 | 7.941 ± 0.242 |
1.899 ± 0.18 | 2.785 ± 0.207 |
Most of the basic statistics you can see at this page can be downloaded from this CSV file
See this proteome in:

Proteome-pI is available under Creative Commons Attribution-NoDerivs license, for more details see here
| Reference: Kozlowski LP. Proteome-pI 2.0: Proteome Isoelectric Point Database Update. Nucleic Acids Res. 2021, doi: 10.1093/nar/gkab944 | Contact: Lukasz P. Kozlowski |