Legionella jordanis
Taxonomy: cellular organisms; Bacteria; Proteobacteria; Gammaproteobacteria; Legionellales; Legionellaceae; Legionella
Average proteome isoelectric point is 6.8
Get precalculated fractions of proteins
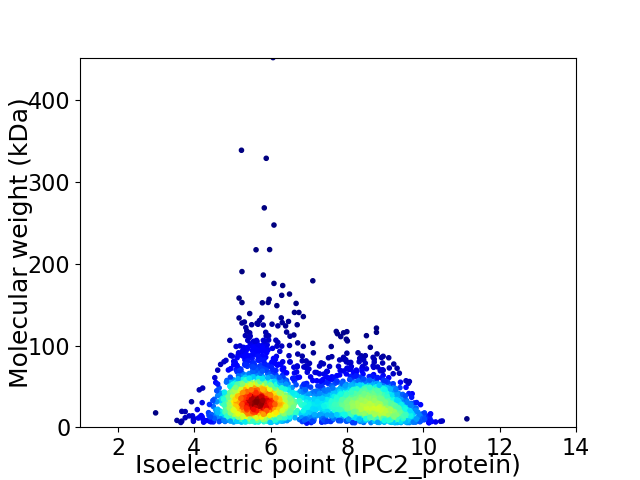
Virtual 2D-PAGE plot for 2787 proteins (isoelectric point calculated using IPC2_protein)
Get csv file with sequences according to given criteria:
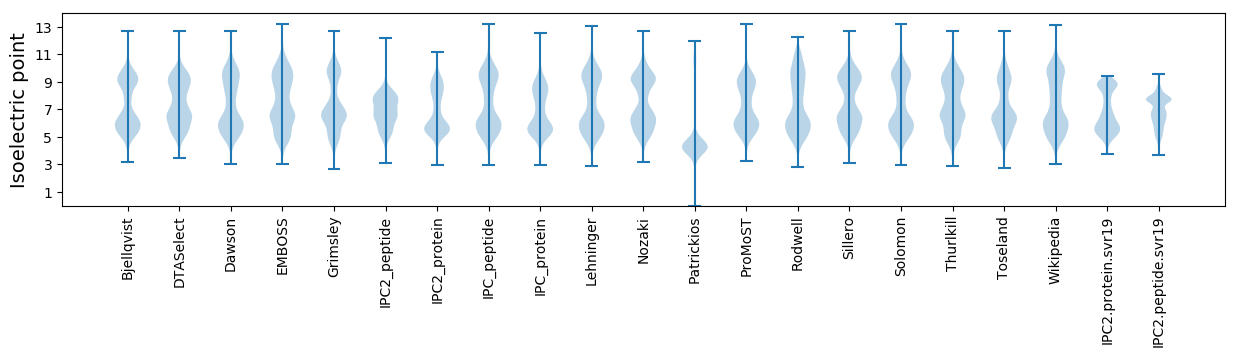
* You can choose from 21 different methods for calculating isoelectric point
Summary statistics related to proteome-wise predictions
Protein with the lowest isoelectric point:
>tr|A0A0W0VAU6|A0A0W0VAU6_9GAMM Putative stress-induced protein OS=Legionella jordanis OX=456 GN=Ljor_1051 PE=4 SV=1
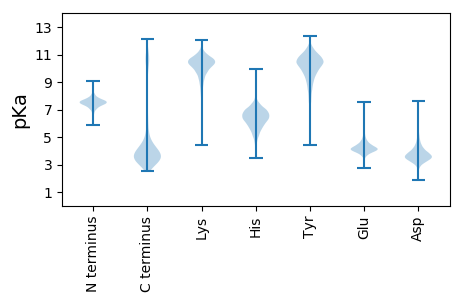
MM1 pKa = 7.94KK2 pKa = 10.24IMQEE6 pKa = 3.98YY7 pKa = 9.8KK8 pKa = 10.33RR9 pKa = 11.84YY10 pKa = 9.34ICVICGFIYY19 pKa = 10.62DD20 pKa = 4.34EE21 pKa = 4.7AEE23 pKa = 3.78GWPEE27 pKa = 4.22DD28 pKa = 4.13GIEE31 pKa = 4.38PGTRR35 pKa = 11.84WEE37 pKa = 4.62DD38 pKa = 3.5VPEE41 pKa = 3.85NWFCPDD47 pKa = 3.39CGAGKK52 pKa = 10.44EE53 pKa = 3.98DD54 pKa = 4.11FEE56 pKa = 4.49MVEE59 pKa = 3.99MDD61 pKa = 3.36
MM1 pKa = 7.94KK2 pKa = 10.24IMQEE6 pKa = 3.98YY7 pKa = 9.8KK8 pKa = 10.33RR9 pKa = 11.84YY10 pKa = 9.34ICVICGFIYY19 pKa = 10.62DD20 pKa = 4.34EE21 pKa = 4.7AEE23 pKa = 3.78GWPEE27 pKa = 4.22DD28 pKa = 4.13GIEE31 pKa = 4.38PGTRR35 pKa = 11.84WEE37 pKa = 4.62DD38 pKa = 3.5VPEE41 pKa = 3.85NWFCPDD47 pKa = 3.39CGAGKK52 pKa = 10.44EE53 pKa = 3.98DD54 pKa = 4.11FEE56 pKa = 4.49MVEE59 pKa = 3.99MDD61 pKa = 3.36
Molecular weight: 7.2 kDa
Isoelectric point according different methods:
Protein with the highest isoelectric point:
>tr|A0A0W0VG73|A0A0W0VG73_9GAMM Uncharacterized protein OS=Legionella jordanis OX=456 GN=Ljor_0048 PE=4 SV=1
AA1 pKa = 7.15QQRR4 pKa = 11.84AQQQAQQRR12 pKa = 11.84AQQQAQQKK20 pKa = 9.25AQQQAQQRR28 pKa = 11.84AQQQAQQQAQQRR40 pKa = 11.84AQQRR44 pKa = 11.84AQQQAQQQAQRR55 pKa = 11.84AAAVRR60 pKa = 11.84SAHH63 pKa = 5.28QAASVRR69 pKa = 11.84AAQQQAQQRR78 pKa = 11.84AQQTAAQRR86 pKa = 11.84AYY88 pKa = 10.66RR89 pKa = 11.84RR90 pKa = 3.74
AA1 pKa = 7.15QQRR4 pKa = 11.84AQQQAQQRR12 pKa = 11.84AQQQAQQKK20 pKa = 9.25AQQQAQQRR28 pKa = 11.84AQQQAQQQAQQRR40 pKa = 11.84AQQRR44 pKa = 11.84AQQQAQQQAQRR55 pKa = 11.84AAAVRR60 pKa = 11.84SAHH63 pKa = 5.28QAASVRR69 pKa = 11.84AAQQQAQQRR78 pKa = 11.84AQQTAAQRR86 pKa = 11.84AYY88 pKa = 10.66RR89 pKa = 11.84RR90 pKa = 3.74
Molecular weight: 10.22 kDa
Isoelectric point according different methods:
Peptides (in silico digests for buttom-up proteomics)
Below you can find in silico digests of the whole proteome with Trypsin, Chymotrypsin, Trypsin+LysC, LysN, ArgC proteases suitable for different mass spec machines.| Try ESI |
 |
|---|
| ChTry ESI |
|
|---|
| ArgC ESI |
|
|---|
| LysN ESI |
|
|---|
| TryLysC ESI |
|
|---|
| Try MALDI |
|
|---|
| ChTry MALDI |
|
|---|
| ArgC MALDI |
|
|---|
| LysN MALDI |
|
|---|
| TryLysC MALDI |
|
|---|
| Try LTQ |
|
|---|
| ChTry LTQ |
|
|---|
| ArgC LTQ |
|
|---|
| LysN LTQ |
|
|---|
| TryLysC LTQ |
|
|---|
| Try MSlow |
|
|---|
| ChTry MSlow |
|
|---|
| ArgC MSlow |
|
|---|
| LysN MSlow |
|
|---|
| TryLysC MSlow |
|
|---|
| Try MShigh |
|
|---|
| ChTry MShigh |
|
|---|
| ArgC MShigh |
|
|---|
| LysN MShigh |
|
|---|
| TryLysC MShigh |
|
|---|
General Statistics
Number of major isoforms |
Number of additional isoforms |
Number of all proteins |
Number of amino acids |
Min. Seq. Length |
Max. Seq. Length |
Avg. Seq. Length |
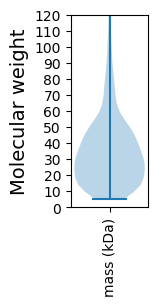
Avg. Mol. Weight |
|---|---|---|---|---|---|---|---|
0 |
923784 |
50 |
3921 |
331.5 |
37.24 |
Amino acid frequency
Ala |
Cys |
Asp |
Glu |
Phe |
Gly |
His |
Ile |
Lys |
Leu |
|---|---|---|---|---|---|---|---|---|---|
8.112 ± 0.049 | 1.213 ± 0.018 |
4.641 ± 0.034 | 6.181 ± 0.051 |
4.619 ± 0.033 | 6.017 ± 0.044 |
2.556 ± 0.022 | 6.961 ± 0.039 |
5.96 ± 0.042 | 11.437 ± 0.055 |
Met |
Asn |
Gln |
Pro |
Arg |
Ser |
Thr |
Val |
Trp |
Tyr |
|---|---|---|---|---|---|---|---|---|---|
2.337 ± 0.018 | 4.669 ± 0.034 |
4.161 ± 0.029 | 4.881 ± 0.041 |
4.561 ± 0.034 | 6.654 ± 0.029 |
4.705 ± 0.03 | 5.824 ± 0.039 |
1.19 ± 0.016 | 3.319 ± 0.027 |
Most of the basic statistics you can see at this page can be downloaded from this CSV file
See this proteome in:

Proteome-pI is available under Creative Commons Attribution-NoDerivs license, for more details see here
| Reference: Kozlowski LP. Proteome-pI 2.0: Proteome Isoelectric Point Database Update. Nucleic Acids Res. 2021, doi: 10.1093/nar/gkab944 | Contact: Lukasz P. Kozlowski |