candidate division MSBL1 archaeon SCGC-AAA261F17
Taxonomy: cellular organisms; Archaea; Euryarchaeota; Euryarchaeota incertae sedis; candidate division MSBL1
Average proteome isoelectric point is 6.39
Get precalculated fractions of proteins
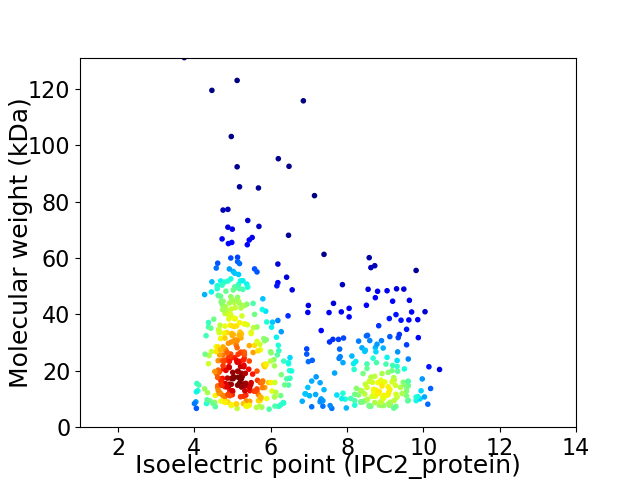
Virtual 2D-PAGE plot for 559 proteins (isoelectric point calculated using IPC2_protein)
Get csv file with sequences according to given criteria:
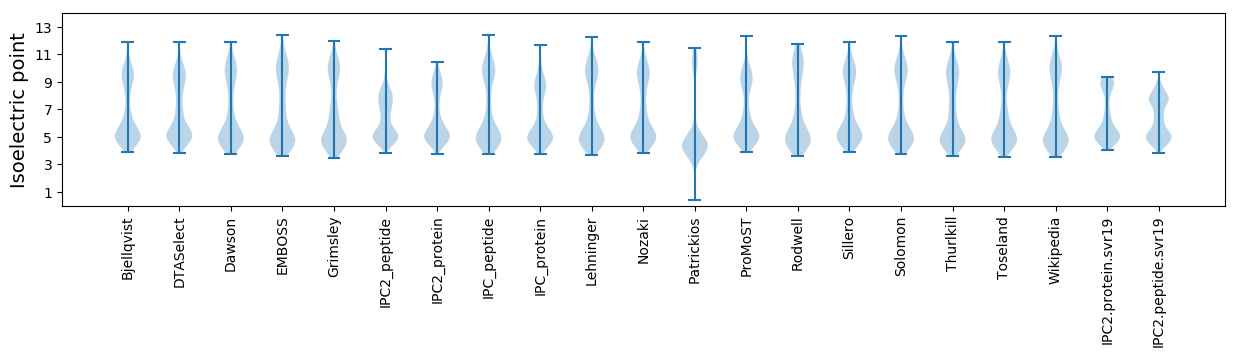
* You can choose from 21 different methods for calculating isoelectric point
Summary statistics related to proteome-wise predictions
Protein with the lowest isoelectric point:
>tr|A0A133V6J2|A0A133V6J2_9EURY Uncharacterized protein OS=candidate division MSBL1 archaeon SCGC-AAA261F17 OX=1698274 GN=AKJ44_01525 PE=4 SV=1
MM1 pKa = 7.15YY2 pKa = 10.58LNGIGSGAEE11 pKa = 3.88NARR14 pKa = 11.84EE15 pKa = 4.06NPSGPSGPEE24 pKa = 3.34IEE26 pKa = 4.28NVRR29 pKa = 11.84EE30 pKa = 3.81NSTRR34 pKa = 11.84PSTPEE39 pKa = 3.51AEE41 pKa = 4.41NARR44 pKa = 11.84EE45 pKa = 4.0NSTGQPPASWWNEE58 pKa = 3.63HH59 pKa = 6.75DD60 pKa = 3.5LHH62 pKa = 7.21AIPGLEE68 pKa = 3.98NASVEE73 pKa = 4.26DD74 pKa = 4.14LPTAEE79 pKa = 4.15EE80 pKa = 4.39VEE82 pKa = 4.37NILFNWPVFEE92 pKa = 5.6NIWTGCWIDD101 pKa = 3.41WNGSYY106 pKa = 10.85QDD108 pKa = 3.71VLNILKK114 pKa = 10.29DD115 pKa = 3.85FNIEE119 pKa = 3.83YY120 pKa = 10.63HH121 pKa = 6.11FGEE124 pKa = 4.18NNKK127 pKa = 10.52LIINTPGIFYY137 pKa = 9.8KK138 pKa = 10.78KK139 pKa = 9.34PGEE142 pKa = 4.74PIPDD146 pKa = 3.11WMTLYY151 pKa = 11.04DD152 pKa = 3.65NSEE155 pKa = 3.88YY156 pKa = 10.78RR157 pKa = 11.84IWNYY161 pKa = 10.91SDD163 pKa = 3.43TLNSLYY169 pKa = 10.42CSRR172 pKa = 11.84YY173 pKa = 9.78LDD175 pKa = 3.35NLGIRR180 pKa = 11.84NGIAIIPVFTATPPLIEE197 pKa = 4.57AKK199 pKa = 10.41VVVPVRR205 pKa = 11.84KK206 pKa = 9.68GLAYY210 pKa = 9.61YY211 pKa = 10.04IPTAGEE217 pKa = 3.69RR218 pKa = 11.84AHH220 pKa = 7.06WAGIWYY226 pKa = 9.73ALNLKK231 pKa = 10.04PGGSNPYY238 pKa = 8.28YY239 pKa = 9.69TDD241 pKa = 4.1PEE243 pKa = 4.44SEE245 pKa = 4.04PLGDD249 pKa = 5.59IEE251 pKa = 4.22IHH253 pKa = 5.17WRR255 pKa = 11.84LGEE258 pKa = 4.11GEE260 pKa = 4.39YY261 pKa = 10.97VDD263 pKa = 4.43WLYY266 pKa = 10.71TPQDD270 pKa = 4.0GEE272 pKa = 4.73PVMTWSDD279 pKa = 3.11NGEE282 pKa = 4.04PVDD285 pKa = 3.58WW286 pKa = 5.27
MM1 pKa = 7.15YY2 pKa = 10.58LNGIGSGAEE11 pKa = 3.88NARR14 pKa = 11.84EE15 pKa = 4.06NPSGPSGPEE24 pKa = 3.34IEE26 pKa = 4.28NVRR29 pKa = 11.84EE30 pKa = 3.81NSTRR34 pKa = 11.84PSTPEE39 pKa = 3.51AEE41 pKa = 4.41NARR44 pKa = 11.84EE45 pKa = 4.0NSTGQPPASWWNEE58 pKa = 3.63HH59 pKa = 6.75DD60 pKa = 3.5LHH62 pKa = 7.21AIPGLEE68 pKa = 3.98NASVEE73 pKa = 4.26DD74 pKa = 4.14LPTAEE79 pKa = 4.15EE80 pKa = 4.39VEE82 pKa = 4.37NILFNWPVFEE92 pKa = 5.6NIWTGCWIDD101 pKa = 3.41WNGSYY106 pKa = 10.85QDD108 pKa = 3.71VLNILKK114 pKa = 10.29DD115 pKa = 3.85FNIEE119 pKa = 3.83YY120 pKa = 10.63HH121 pKa = 6.11FGEE124 pKa = 4.18NNKK127 pKa = 10.52LIINTPGIFYY137 pKa = 9.8KK138 pKa = 10.78KK139 pKa = 9.34PGEE142 pKa = 4.74PIPDD146 pKa = 3.11WMTLYY151 pKa = 11.04DD152 pKa = 3.65NSEE155 pKa = 3.88YY156 pKa = 10.78RR157 pKa = 11.84IWNYY161 pKa = 10.91SDD163 pKa = 3.43TLNSLYY169 pKa = 10.42CSRR172 pKa = 11.84YY173 pKa = 9.78LDD175 pKa = 3.35NLGIRR180 pKa = 11.84NGIAIIPVFTATPPLIEE197 pKa = 4.57AKK199 pKa = 10.41VVVPVRR205 pKa = 11.84KK206 pKa = 9.68GLAYY210 pKa = 9.61YY211 pKa = 10.04IPTAGEE217 pKa = 3.69RR218 pKa = 11.84AHH220 pKa = 7.06WAGIWYY226 pKa = 9.73ALNLKK231 pKa = 10.04PGGSNPYY238 pKa = 8.28YY239 pKa = 9.69TDD241 pKa = 4.1PEE243 pKa = 4.44SEE245 pKa = 4.04PLGDD249 pKa = 5.59IEE251 pKa = 4.22IHH253 pKa = 5.17WRR255 pKa = 11.84LGEE258 pKa = 4.11GEE260 pKa = 4.39YY261 pKa = 10.97VDD263 pKa = 4.43WLYY266 pKa = 10.71TPQDD270 pKa = 4.0GEE272 pKa = 4.73PVMTWSDD279 pKa = 3.11NGEE282 pKa = 4.04PVDD285 pKa = 3.58WW286 pKa = 5.27
Molecular weight: 32.44 kDa
Isoelectric point according different methods:
Protein with the highest isoelectric point:
>tr|A0A133V6Y7|A0A133V6Y7_9EURY Uncharacterized protein OS=candidate division MSBL1 archaeon SCGC-AAA261F17 OX=1698274 GN=AKJ44_01165 PE=4 SV=1
MM1 pKa = 7.66GSWQRR6 pKa = 11.84KK7 pKa = 7.66ALIALFYY14 pKa = 10.45PFTLLMIVAGFTAFVLLVFDD34 pKa = 5.04FSTFFAATVALCFFSFSATILYY56 pKa = 10.28LIFRR60 pKa = 11.84PVIKK64 pKa = 10.19LLNVRR69 pKa = 11.84RR70 pKa = 11.84IFLGLVVAADD80 pKa = 3.51VLAILSLGTLLLRR93 pKa = 11.84GIVV96 pKa = 3.26
MM1 pKa = 7.66GSWQRR6 pKa = 11.84KK7 pKa = 7.66ALIALFYY14 pKa = 10.45PFTLLMIVAGFTAFVLLVFDD34 pKa = 5.04FSTFFAATVALCFFSFSATILYY56 pKa = 10.28LIFRR60 pKa = 11.84PVIKK64 pKa = 10.19LLNVRR69 pKa = 11.84RR70 pKa = 11.84IFLGLVVAADD80 pKa = 3.51VLAILSLGTLLLRR93 pKa = 11.84GIVV96 pKa = 3.26
Molecular weight: 10.67 kDa
Isoelectric point according different methods:
Peptides (in silico digests for buttom-up proteomics)
Below you can find in silico digests of the whole proteome with Trypsin, Chymotrypsin, Trypsin+LysC, LysN, ArgC proteases suitable for different mass spec machines.| Try ESI |
 |
|---|
| ChTry ESI |
|
|---|
| ArgC ESI |
|
|---|
| LysN ESI |
|
|---|
| TryLysC ESI |
|
|---|
| Try MALDI |
|
|---|
| ChTry MALDI |
|
|---|
| ArgC MALDI |
|
|---|
| LysN MALDI |
|
|---|
| TryLysC MALDI |
|
|---|
| Try LTQ |
|
|---|
| ChTry LTQ |
|
|---|
| ArgC LTQ |
|
|---|
| LysN LTQ |
|
|---|
| TryLysC LTQ |
|
|---|
| Try MSlow |
|
|---|
| ChTry MSlow |
|
|---|
| ArgC MSlow |
|
|---|
| LysN MSlow |
|
|---|
| TryLysC MSlow |
|
|---|
| Try MShigh |
|
|---|
| ChTry MShigh |
|
|---|
| ArgC MShigh |
|
|---|
| LysN MShigh |
|
|---|
| TryLysC MShigh |
|
|---|
General Statistics
Number of major isoforms |
Number of additional isoforms |
Number of all proteins |
Number of amino acids |
Min. Seq. Length |
Max. Seq. Length |
Avg. Seq. Length |
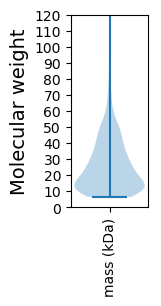
Avg. Mol. Weight |
|---|---|---|---|---|---|---|---|
0 |
134315 |
59 |
1253 |
240.3 |
26.96 |
Amino acid frequency
Ala |
Cys |
Asp |
Glu |
Phe |
Gly |
His |
Ile |
Lys |
Leu |
|---|---|---|---|---|---|---|---|---|---|
6.903 ± 0.138 | 0.939 ± 0.047 |
5.583 ± 0.091 | 9.559 ± 0.145 |
3.533 ± 0.08 | 7.499 ± 0.109 |
1.846 ± 0.046 | 6.99 ± 0.086 |
7.421 ± 0.146 | 9.42 ± 0.121 |
Met |
Asn |
Gln |
Pro |
Arg |
Ser |
Thr |
Val |
Trp |
Tyr |
|---|---|---|---|---|---|---|---|---|---|
2.178 ± 0.05 | 3.385 ± 0.074 |
4.209 ± 0.077 | 2.527 ± 0.061 |
5.871 ± 0.127 | 6.055 ± 0.08 |
5.043 ± 0.097 | 6.973 ± 0.083 |
1.167 ± 0.047 | 2.898 ± 0.06 |
Most of the basic statistics you can see at this page can be downloaded from this CSV file
See this proteome in:

Proteome-pI is available under Creative Commons Attribution-NoDerivs license, for more details see here
| Reference: Kozlowski LP. Proteome-pI 2.0: Proteome Isoelectric Point Database Update. Nucleic Acids Res. 2021, doi: 10.1093/nar/gkab944 | Contact: Lukasz P. Kozlowski |