Apis mellifera associated microvirus 52
Taxonomy: Viruses; Monodnaviria; Sangervirae; Phixviricota; Malgrandaviricetes; Petitvirales; Microviridae; unclassified Microviridae
Average proteome isoelectric point is 7.41
Get precalculated fractions of proteins
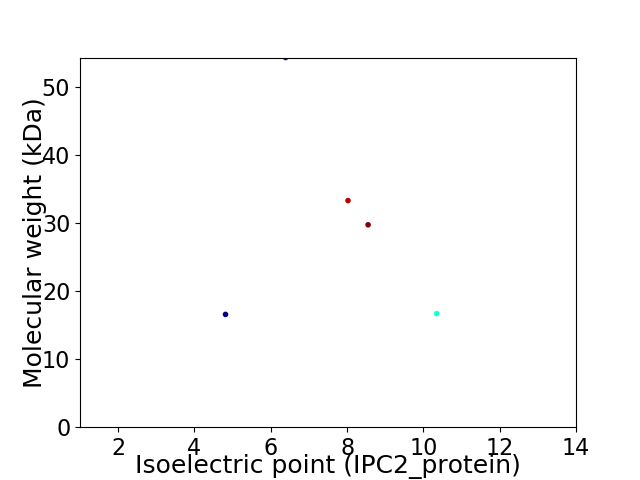
Virtual 2D-PAGE plot for 5 proteins (isoelectric point calculated using IPC2_protein)
Get csv file with sequences according to given criteria:
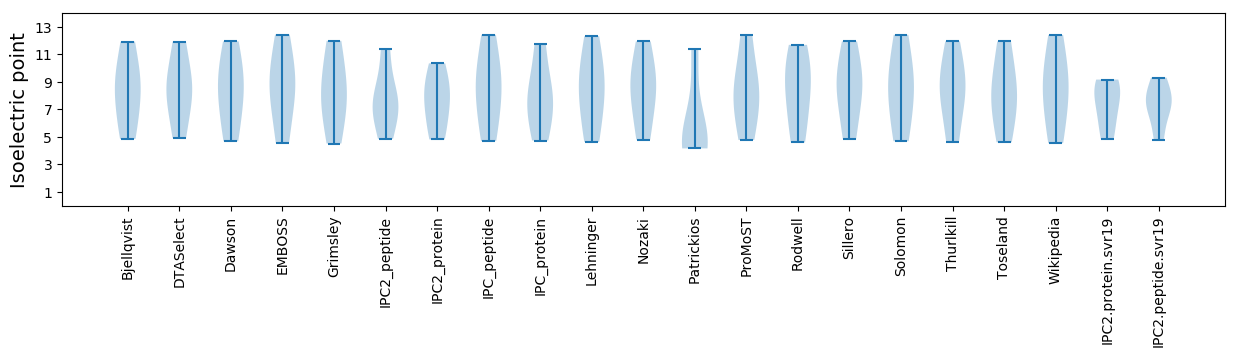
* You can choose from 21 different methods for calculating isoelectric point
Summary statistics related to proteome-wise predictions
Protein with the lowest isoelectric point:
>tr|A0A3Q8U5Y3|A0A3Q8U5Y3_9VIRU Uncharacterized protein OS=Apis mellifera associated microvirus 52 OX=2494783 PE=4 SV=1
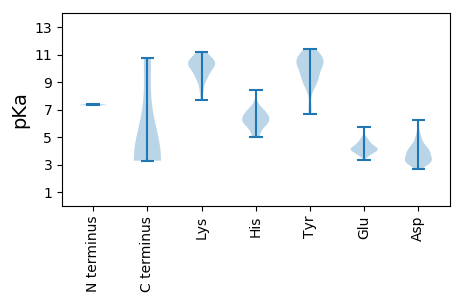
MM1 pKa = 7.43KK2 pKa = 10.31KK3 pKa = 10.08KK4 pKa = 10.54NSDD7 pKa = 3.14MRR9 pKa = 11.84HH10 pKa = 4.99YY11 pKa = 10.51EE12 pKa = 3.95AVDD15 pKa = 3.92SNPHH19 pKa = 5.01AMAVKK24 pKa = 9.78IQRR27 pKa = 11.84PPTLAEE33 pKa = 3.82QIQAYY38 pKa = 8.55MGQHH42 pKa = 5.22NRR44 pKa = 11.84RR45 pKa = 11.84LEE47 pKa = 3.91QLGVEE52 pKa = 4.38TAEE55 pKa = 4.14EE56 pKa = 4.04ADD58 pKa = 4.05DD59 pKa = 5.22FDD61 pKa = 6.21VEE63 pKa = 5.72DD64 pKa = 4.3EE65 pKa = 4.7DD66 pKa = 5.76APEE69 pKa = 4.38SPHH72 pKa = 6.23EE73 pKa = 4.09LVYY76 pKa = 11.06DD77 pKa = 3.85PLLNRR82 pKa = 11.84EE83 pKa = 4.07LPRR86 pKa = 11.84YY87 pKa = 9.33QKK89 pKa = 11.12VLIDD93 pKa = 3.35QDD95 pKa = 3.39RR96 pKa = 11.84AKK98 pKa = 10.59FDD100 pKa = 3.34EE101 pKa = 4.02QLADD105 pKa = 4.07KK106 pKa = 10.69IRR108 pKa = 11.84ADD110 pKa = 3.8RR111 pKa = 11.84LAAEE115 pKa = 4.42AARR118 pKa = 11.84RR119 pKa = 11.84ARR121 pKa = 11.84AHH123 pKa = 6.42LEE125 pKa = 4.3SNGGNAGRR133 pKa = 11.84QIEE136 pKa = 4.64TTTEE140 pKa = 4.04EE141 pKa = 4.2PSEE144 pKa = 4.21DD145 pKa = 3.35
MM1 pKa = 7.43KK2 pKa = 10.31KK3 pKa = 10.08KK4 pKa = 10.54NSDD7 pKa = 3.14MRR9 pKa = 11.84HH10 pKa = 4.99YY11 pKa = 10.51EE12 pKa = 3.95AVDD15 pKa = 3.92SNPHH19 pKa = 5.01AMAVKK24 pKa = 9.78IQRR27 pKa = 11.84PPTLAEE33 pKa = 3.82QIQAYY38 pKa = 8.55MGQHH42 pKa = 5.22NRR44 pKa = 11.84RR45 pKa = 11.84LEE47 pKa = 3.91QLGVEE52 pKa = 4.38TAEE55 pKa = 4.14EE56 pKa = 4.04ADD58 pKa = 4.05DD59 pKa = 5.22FDD61 pKa = 6.21VEE63 pKa = 5.72DD64 pKa = 4.3EE65 pKa = 4.7DD66 pKa = 5.76APEE69 pKa = 4.38SPHH72 pKa = 6.23EE73 pKa = 4.09LVYY76 pKa = 11.06DD77 pKa = 3.85PLLNRR82 pKa = 11.84EE83 pKa = 4.07LPRR86 pKa = 11.84YY87 pKa = 9.33QKK89 pKa = 11.12VLIDD93 pKa = 3.35QDD95 pKa = 3.39RR96 pKa = 11.84AKK98 pKa = 10.59FDD100 pKa = 3.34EE101 pKa = 4.02QLADD105 pKa = 4.07KK106 pKa = 10.69IRR108 pKa = 11.84ADD110 pKa = 3.8RR111 pKa = 11.84LAAEE115 pKa = 4.42AARR118 pKa = 11.84RR119 pKa = 11.84ARR121 pKa = 11.84AHH123 pKa = 6.42LEE125 pKa = 4.3SNGGNAGRR133 pKa = 11.84QIEE136 pKa = 4.64TTTEE140 pKa = 4.04EE141 pKa = 4.2PSEE144 pKa = 4.21DD145 pKa = 3.35
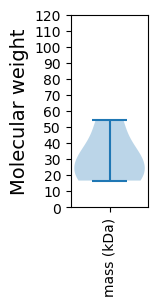
Molecular weight: 16.56 kDa
Isoelectric point according different methods:
Protein with the highest isoelectric point:
>tr|A0A3S8UU80|A0A3S8UU80_9VIRU Major capsid protein OS=Apis mellifera associated microvirus 52 OX=2494783 PE=3 SV=1
MM1 pKa = 7.35MGRR4 pKa = 11.84SRR6 pKa = 11.84NRR8 pKa = 11.84TRR10 pKa = 11.84ATVSNRR16 pKa = 11.84RR17 pKa = 11.84LRR19 pKa = 11.84STTTTTHH26 pKa = 6.55FSSTPAIDD34 pKa = 4.16LNRR37 pKa = 11.84LAALLSPPSLQNNYY51 pKa = 6.88STRR54 pKa = 11.84RR55 pKa = 11.84TARR58 pKa = 11.84VYY60 pKa = 10.72APPRR64 pKa = 11.84TTTPSQPPRR73 pKa = 11.84AQQRR77 pKa = 11.84RR78 pKa = 11.84LRR80 pKa = 11.84SNTSLSTGVWHH91 pKa = 6.2QVGSPVRR98 pKa = 11.84KK99 pKa = 9.31PSDD102 pKa = 3.12EE103 pKa = 4.43HH104 pKa = 8.41KK105 pKa = 10.39PDD107 pKa = 3.39EE108 pKa = 4.44ALVCVSRR115 pKa = 11.84SEE117 pKa = 4.06RR118 pKa = 11.84RR119 pKa = 11.84EE120 pKa = 3.72VLHH123 pKa = 6.98ALRR126 pKa = 11.84KK127 pKa = 7.68TGKK130 pKa = 8.26TGQKK134 pKa = 9.52SPKK137 pKa = 9.07FSRR140 pKa = 11.84ASKK143 pKa = 9.34IHH145 pKa = 6.16CKK147 pKa = 10.1KK148 pKa = 10.77
MM1 pKa = 7.35MGRR4 pKa = 11.84SRR6 pKa = 11.84NRR8 pKa = 11.84TRR10 pKa = 11.84ATVSNRR16 pKa = 11.84RR17 pKa = 11.84LRR19 pKa = 11.84STTTTTHH26 pKa = 6.55FSSTPAIDD34 pKa = 4.16LNRR37 pKa = 11.84LAALLSPPSLQNNYY51 pKa = 6.88STRR54 pKa = 11.84RR55 pKa = 11.84TARR58 pKa = 11.84VYY60 pKa = 10.72APPRR64 pKa = 11.84TTTPSQPPRR73 pKa = 11.84AQQRR77 pKa = 11.84RR78 pKa = 11.84LRR80 pKa = 11.84SNTSLSTGVWHH91 pKa = 6.2QVGSPVRR98 pKa = 11.84KK99 pKa = 9.31PSDD102 pKa = 3.12EE103 pKa = 4.43HH104 pKa = 8.41KK105 pKa = 10.39PDD107 pKa = 3.39EE108 pKa = 4.44ALVCVSRR115 pKa = 11.84SEE117 pKa = 4.06RR118 pKa = 11.84RR119 pKa = 11.84EE120 pKa = 3.72VLHH123 pKa = 6.98ALRR126 pKa = 11.84KK127 pKa = 7.68TGKK130 pKa = 8.26TGQKK134 pKa = 9.52SPKK137 pKa = 9.07FSRR140 pKa = 11.84ASKK143 pKa = 9.34IHH145 pKa = 6.16CKK147 pKa = 10.1KK148 pKa = 10.77
Molecular weight: 16.68 kDa
Isoelectric point according different methods:
Peptides (in silico digests for buttom-up proteomics)
Below you can find in silico digests of the whole proteome with Trypsin, Chymotrypsin, Trypsin+LysC, LysN, ArgC proteases suitable for different mass spec machines.| Try ESI |
 |
|---|
| ChTry ESI |
|
|---|
| ArgC ESI |
|
|---|
| LysN ESI |
|
|---|
| TryLysC ESI |
|
|---|
| Try MALDI |
|
|---|
| ChTry MALDI |
|
|---|
| ArgC MALDI |
|
|---|
| LysN MALDI |
|
|---|
| TryLysC MALDI |
|
|---|
| Try LTQ |
|
|---|
| ChTry LTQ |
|
|---|
| ArgC LTQ |
|
|---|
| LysN LTQ |
|
|---|
| TryLysC LTQ |
|
|---|
| Try MSlow |
|
|---|
| ChTry MSlow |
|
|---|
| ArgC MSlow |
|
|---|
| LysN MSlow |
|
|---|
| TryLysC MSlow |
|
|---|
| Try MShigh |
|
|---|
| ChTry MShigh |
|
|---|
| ArgC MShigh |
|
|---|
| LysN MShigh |
|
|---|
| TryLysC MShigh |
|
|---|
General Statistics
Number of major isoforms |
Number of additional isoforms |
Number of all proteins |
Number of amino acids |
Min. Seq. Length |
Max. Seq. Length |
Avg. Seq. Length |
Avg. Mol. Weight |
|---|---|---|---|---|---|---|---|
0 |
1359 |
145 |
495 |
271.8 |
30.1 |
Amino acid frequency
Ala |
Cys |
Asp |
Glu |
Phe |
Gly |
His |
Ile |
Lys |
Leu |
|---|---|---|---|---|---|---|---|---|---|
9.713 ± 0.928 | 0.736 ± 0.408 |
5.445 ± 0.826 | 5.592 ± 1.173 |
3.753 ± 0.588 | 7.873 ± 1.162 |
2.502 ± 0.235 | 4.047 ± 0.466 |
5.445 ± 1.314 | 7.8 ± 1.081 |
Met |
Asn |
Gln |
Pro |
Arg |
Ser |
Thr |
Val |
Trp |
Tyr |
|---|---|---|---|---|---|---|---|---|---|
1.619 ± 0.295 | 4.415 ± 0.69 |
5.96 ± 0.39 | 4.489 ± 0.613 |
7.138 ± 1.07 | 6.696 ± 0.989 |
7.285 ± 1.333 | 4.857 ± 0.726 |
1.251 ± 0.318 | 3.385 ± 0.592 |
Most of the basic statistics you can see at this page can be downloaded from this CSV file
See this proteome in:

Proteome-pI is available under Creative Commons Attribution-NoDerivs license, for more details see here
| Reference: Kozlowski LP. Proteome-pI 2.0: Proteome Isoelectric Point Database Update. Nucleic Acids Res. 2021, doi: 10.1093/nar/gkab944 | Contact: Lukasz P. Kozlowski |