Pyrolobus fumarii (strain DSM 11204 / 1A)
Taxonomy: cellular organisms; Archaea; TACK group; Crenarchaeota; Thermoprotei; Desulfurococcales; Pyrodictiaceae; Pyrolobus; Pyrolobus fumarii
Average proteome isoelectric point is 7.11
Get precalculated fractions of proteins
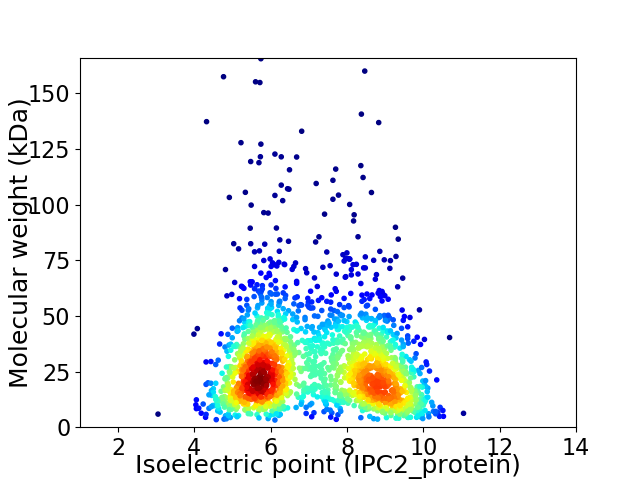
Virtual 2D-PAGE plot for 1967 proteins (isoelectric point calculated using IPC2_protein)
Get csv file with sequences according to given criteria:
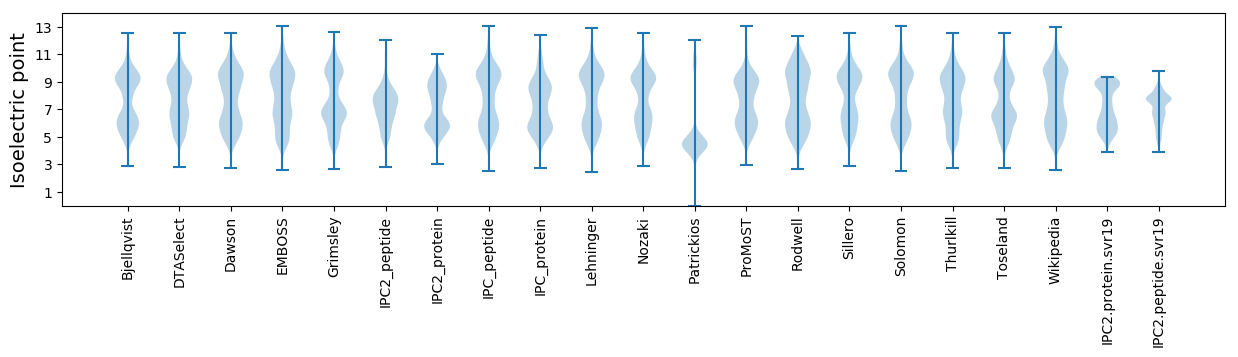
* You can choose from 21 different methods for calculating isoelectric point
Summary statistics related to proteome-wise predictions
Protein with the lowest isoelectric point:
>tr|G0EFN3|G0EFN3_PYRF1 PilT protein domain protein OS=Pyrolobus fumarii (strain DSM 11204 / 1A) OX=694429 GN=Pyrfu_0332 PE=4 SV=1
MM1 pKa = 7.42IASDD5 pKa = 5.22PIPSVAEE12 pKa = 4.17GMVLLYY18 pKa = 10.11PILTSDD24 pKa = 4.06YY25 pKa = 9.27VSSSSVEE32 pKa = 3.93TMRR35 pKa = 11.84PAEE38 pKa = 4.17LASAILAVHH47 pKa = 6.37VVLQNVGCVEE57 pKa = 3.9ADD59 pKa = 2.99IVYY62 pKa = 10.14LAVGPEE68 pKa = 4.12DD69 pKa = 3.68NNKK72 pKa = 10.0LSNLSSYY79 pKa = 11.13
MM1 pKa = 7.42IASDD5 pKa = 5.22PIPSVAEE12 pKa = 4.17GMVLLYY18 pKa = 10.11PILTSDD24 pKa = 4.06YY25 pKa = 9.27VSSSSVEE32 pKa = 3.93TMRR35 pKa = 11.84PAEE38 pKa = 4.17LASAILAVHH47 pKa = 6.37VVLQNVGCVEE57 pKa = 3.9ADD59 pKa = 2.99IVYY62 pKa = 10.14LAVGPEE68 pKa = 4.12DD69 pKa = 3.68NNKK72 pKa = 10.0LSNLSSYY79 pKa = 11.13
Molecular weight: 8.34 kDa
Isoelectric point according different methods:
Protein with the highest isoelectric point:
>tr|G0EEP5|G0EEP5_PYRF1 Glycine cleavage system T protein OS=Pyrolobus fumarii (strain DSM 11204 / 1A) OX=694429 GN=Pyrfu_0999 PE=3 SV=1
MM1 pKa = 7.61ARR3 pKa = 11.84NKK5 pKa = 9.96PLARR9 pKa = 11.84KK10 pKa = 9.11LRR12 pKa = 11.84LAKK15 pKa = 10.02AYY17 pKa = 9.64KK18 pKa = 10.13SNSPVPVWVIVKK30 pKa = 7.15TNRR33 pKa = 11.84RR34 pKa = 11.84FTTHH38 pKa = 6.52PKK40 pKa = 8.18RR41 pKa = 11.84RR42 pKa = 11.84HH43 pKa = 4.31WRR45 pKa = 11.84RR46 pKa = 11.84NWIKK50 pKa = 10.88AA51 pKa = 3.31
MM1 pKa = 7.61ARR3 pKa = 11.84NKK5 pKa = 9.96PLARR9 pKa = 11.84KK10 pKa = 9.11LRR12 pKa = 11.84LAKK15 pKa = 10.02AYY17 pKa = 9.64KK18 pKa = 10.13SNSPVPVWVIVKK30 pKa = 7.15TNRR33 pKa = 11.84RR34 pKa = 11.84FTTHH38 pKa = 6.52PKK40 pKa = 8.18RR41 pKa = 11.84RR42 pKa = 11.84HH43 pKa = 4.31WRR45 pKa = 11.84RR46 pKa = 11.84NWIKK50 pKa = 10.88AA51 pKa = 3.31
Molecular weight: 6.24 kDa
Isoelectric point according different methods:
Peptides (in silico digests for buttom-up proteomics)
Below you can find in silico digests of the whole proteome with Trypsin, Chymotrypsin, Trypsin+LysC, LysN, ArgC proteases suitable for different mass spec machines.| Try ESI |
 |
|---|
| ChTry ESI |
|
|---|
| ArgC ESI |
|
|---|
| LysN ESI |
|
|---|
| TryLysC ESI |
|
|---|
| Try MALDI |
|
|---|
| ChTry MALDI |
|
|---|
| ArgC MALDI |
|
|---|
| LysN MALDI |
|
|---|
| TryLysC MALDI |
|
|---|
| Try LTQ |
|
|---|
| ChTry LTQ |
|
|---|
| ArgC LTQ |
|
|---|
| LysN LTQ |
|
|---|
| TryLysC LTQ |
|
|---|
| Try MSlow |
|
|---|
| ChTry MSlow |
|
|---|
| ArgC MSlow |
|
|---|
| LysN MSlow |
|
|---|
| TryLysC MSlow |
|
|---|
| Try MShigh |
|
|---|
| ChTry MShigh |
|
|---|
| ArgC MShigh |
|
|---|
| LysN MShigh |
|
|---|
| TryLysC MShigh |
|
|---|
General Statistics
Number of major isoforms |
Number of additional isoforms |
Number of all proteins |
Number of amino acids |
Min. Seq. Length |
Max. Seq. Length |
Avg. Seq. Length |
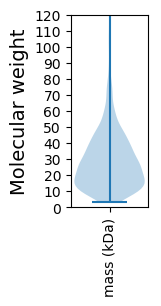
Avg. Mol. Weight |
|---|---|---|---|---|---|---|---|
0 |
536901 |
33 |
1552 |
273.0 |
30.33 |
Amino acid frequency
Ala |
Cys |
Asp |
Glu |
Phe |
Gly |
His |
Ile |
Lys |
Leu |
|---|---|---|---|---|---|---|---|---|---|
9.553 ± 0.066 | 1.053 ± 0.026 |
4.323 ± 0.037 | 7.865 ± 0.073 |
2.631 ± 0.029 | 7.501 ± 0.047 |
1.881 ± 0.026 | 5.888 ± 0.043 |
4.512 ± 0.055 | 11.273 ± 0.073 |
Met |
Asn |
Gln |
Pro |
Arg |
Ser |
Thr |
Val |
Trp |
Tyr |
|---|---|---|---|---|---|---|---|---|---|
2.167 ± 0.023 | 2.136 ± 0.033 |
4.996 ± 0.039 | 1.716 ± 0.022 |
8.144 ± 0.073 | 5.153 ± 0.042 |
4.497 ± 0.052 | 9.823 ± 0.058 |
1.36 ± 0.022 | 3.527 ± 0.038 |
Most of the basic statistics you can see at this page can be downloaded from this CSV file
See this proteome in:

Proteome-pI is available under Creative Commons Attribution-NoDerivs license, for more details see here
| Reference: Kozlowski LP. Proteome-pI 2.0: Proteome Isoelectric Point Database Update. Nucleic Acids Res. 2021, doi: 10.1093/nar/gkab944 | Contact: Lukasz P. Kozlowski |