Ascoidea rubescens DSM 1968
Taxonomy: cellular organisms; Eukaryota; Opisthokonta; Fungi; Dikarya; Ascomycota; saccharomyceta; Saccharomycotina; Saccharomycetes; Saccharomycetales; Ascoideaceae; Ascoidea; Ascoidea rubescens
Average proteome isoelectric point is 6.87
Get precalculated fractions of proteins
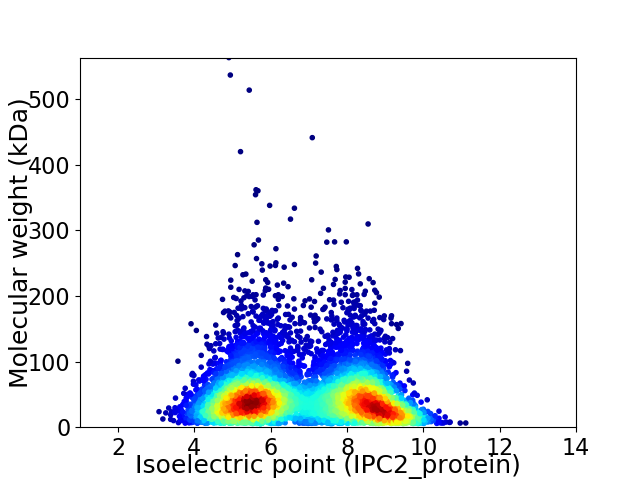
Virtual 2D-PAGE plot for 6735 proteins (isoelectric point calculated using IPC2_protein)
Get csv file with sequences according to given criteria:
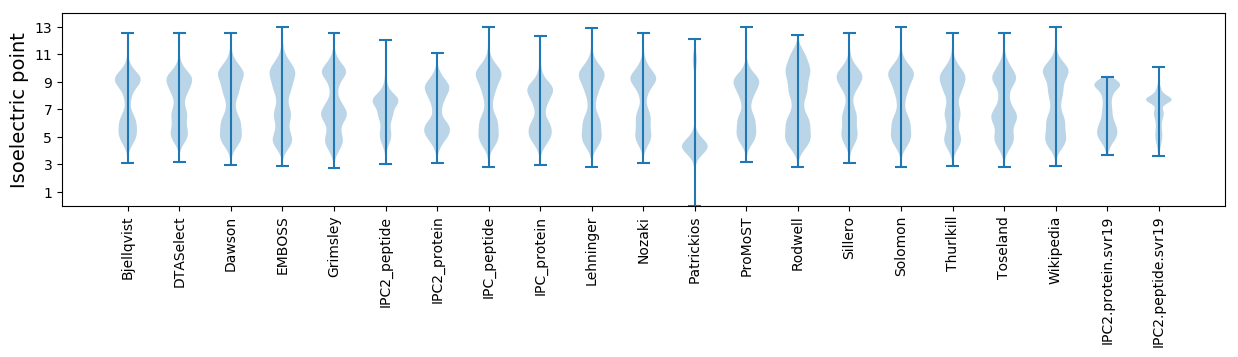
* You can choose from 21 different methods for calculating isoelectric point
Summary statistics related to proteome-wise predictions
Protein with the lowest isoelectric point:
>tr|A0A1D2VMV0|A0A1D2VMV0_9ASCO O-acetylhomoserine ami OS=Ascoidea rubescens DSM 1968 OX=1344418 GN=ASCRUDRAFT_68727 PE=3 SV=1
MM1 pKa = 7.36VYY3 pKa = 9.19STFTSDD9 pKa = 3.22NADD12 pKa = 4.32FININDD18 pKa = 3.82AVQITHH24 pKa = 7.7LLHH27 pKa = 6.53NHH29 pKa = 7.0DD30 pKa = 5.13EE31 pKa = 5.01PIQSKK36 pKa = 8.6DD37 pKa = 3.44TNPSIVEE44 pKa = 3.69VDD46 pKa = 3.49AVEE49 pKa = 5.1LYY51 pKa = 11.01NNNLGRR57 pKa = 11.84TRR59 pKa = 11.84TSSFSSEE66 pKa = 3.67INSPSEE72 pKa = 3.87EE73 pKa = 4.19VVDD76 pKa = 4.18PFTNTEE82 pKa = 3.91NKK84 pKa = 9.21VAEE87 pKa = 4.15VDD89 pKa = 3.86YY90 pKa = 8.6FTSDD94 pKa = 3.15EE95 pKa = 4.57LVWQPVVSSFADD107 pKa = 3.5DD108 pKa = 3.93FNSVGDD114 pKa = 3.55VDD116 pKa = 4.3YY117 pKa = 11.32YY118 pKa = 11.38QYY120 pKa = 12.0
MM1 pKa = 7.36VYY3 pKa = 9.19STFTSDD9 pKa = 3.22NADD12 pKa = 4.32FININDD18 pKa = 3.82AVQITHH24 pKa = 7.7LLHH27 pKa = 6.53NHH29 pKa = 7.0DD30 pKa = 5.13EE31 pKa = 5.01PIQSKK36 pKa = 8.6DD37 pKa = 3.44TNPSIVEE44 pKa = 3.69VDD46 pKa = 3.49AVEE49 pKa = 5.1LYY51 pKa = 11.01NNNLGRR57 pKa = 11.84TRR59 pKa = 11.84TSSFSSEE66 pKa = 3.67INSPSEE72 pKa = 3.87EE73 pKa = 4.19VVDD76 pKa = 4.18PFTNTEE82 pKa = 3.91NKK84 pKa = 9.21VAEE87 pKa = 4.15VDD89 pKa = 3.86YY90 pKa = 8.6FTSDD94 pKa = 3.15EE95 pKa = 4.57LVWQPVVSSFADD107 pKa = 3.5DD108 pKa = 3.93FNSVGDD114 pKa = 3.55VDD116 pKa = 4.3YY117 pKa = 11.32YY118 pKa = 11.38QYY120 pKa = 12.0
Molecular weight: 13.58 kDa
Isoelectric point according different methods:
Protein with the highest isoelectric point:
>tr|A0A1D2VQS6|A0A1D2VQS6_9ASCO Exosome complex exonuclease RRP44 OS=Ascoidea rubescens DSM 1968 OX=1344418 GN=ASCRUDRAFT_29311 PE=3 SV=1
LL1 pKa = 5.9QRR3 pKa = 11.84RR4 pKa = 11.84WKK6 pKa = 10.81ARR8 pKa = 11.84GNTYY12 pKa = 10.27QPSTLKK18 pKa = 10.25RR19 pKa = 11.84KK20 pKa = 9.45RR21 pKa = 11.84RR22 pKa = 11.84FGFFARR28 pKa = 11.84MTSRR32 pKa = 11.84TGRR35 pKa = 11.84KK36 pKa = 8.28IMQRR40 pKa = 11.84RR41 pKa = 11.84RR42 pKa = 11.84SKK44 pKa = 10.3GRR46 pKa = 11.84WYY48 pKa = 9.14LTHH51 pKa = 7.23
LL1 pKa = 5.9QRR3 pKa = 11.84RR4 pKa = 11.84WKK6 pKa = 10.81ARR8 pKa = 11.84GNTYY12 pKa = 10.27QPSTLKK18 pKa = 10.25RR19 pKa = 11.84KK20 pKa = 9.45RR21 pKa = 11.84RR22 pKa = 11.84FGFFARR28 pKa = 11.84MTSRR32 pKa = 11.84TGRR35 pKa = 11.84KK36 pKa = 8.28IMQRR40 pKa = 11.84RR41 pKa = 11.84RR42 pKa = 11.84SKK44 pKa = 10.3GRR46 pKa = 11.84WYY48 pKa = 9.14LTHH51 pKa = 7.23
Molecular weight: 6.41 kDa
Isoelectric point according different methods:
Peptides (in silico digests for buttom-up proteomics)
Below you can find in silico digests of the whole proteome with Trypsin, Chymotrypsin, Trypsin+LysC, LysN, ArgC proteases suitable for different mass spec machines.| Try ESI |
 |
|---|
| ChTry ESI |
|
|---|
| ArgC ESI |
|
|---|
| LysN ESI |
|
|---|
| TryLysC ESI |
|
|---|
| Try MALDI |
|
|---|
| ChTry MALDI |
|
|---|
| ArgC MALDI |
|
|---|
| LysN MALDI |
|
|---|
| TryLysC MALDI |
|
|---|
| Try LTQ |
|
|---|
| ChTry LTQ |
|
|---|
| ArgC LTQ |
|
|---|
| LysN LTQ |
|
|---|
| TryLysC LTQ |
|
|---|
| Try MSlow |
|
|---|
| ChTry MSlow |
|
|---|
| ArgC MSlow |
|
|---|
| LysN MSlow |
|
|---|
| TryLysC MSlow |
|
|---|
| Try MShigh |
|
|---|
| ChTry MShigh |
|
|---|
| ArgC MShigh |
|
|---|
| LysN MShigh |
|
|---|
| TryLysC MShigh |
|
|---|
General Statistics
Number of major isoforms |
Number of additional isoforms |
Number of all proteins |
Number of amino acids |
Min. Seq. Length |
Max. Seq. Length |
Avg. Seq. Length |
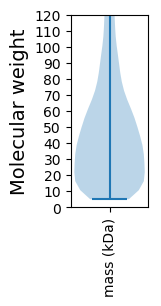
Avg. Mol. Weight |
|---|---|---|---|---|---|---|---|
3141677 |
49 |
4919 |
466.5 |
53.2 |
Amino acid frequency
Ala |
Cys |
Asp |
Glu |
Phe |
Gly |
His |
Ile |
Lys |
Leu |
|---|---|---|---|---|---|---|---|---|---|
3.976 ± 0.029 | 1.087 ± 0.01 |
5.919 ± 0.024 | 5.585 ± 0.031 |
5.019 ± 0.025 | 3.945 ± 0.028 |
1.876 ± 0.01 | 8.163 ± 0.028 |
8.142 ± 0.039 | 9.844 ± 0.037 |
Met |
Asn |
Gln |
Pro |
Arg |
Ser |
Thr |
Val |
Trp |
Tyr |
|---|---|---|---|---|---|---|---|---|---|
1.46 ± 0.009 | 10.668 ± 0.075 |
3.77 ± 0.022 | 3.683 ± 0.028 |
3.384 ± 0.018 | 9.663 ± 0.039 |
5.027 ± 0.023 | 4.308 ± 0.025 |
0.8 ± 0.01 | 3.678 ± 0.021 |
Most of the basic statistics you can see at this page can be downloaded from this CSV file
See this proteome in:

Proteome-pI is available under Creative Commons Attribution-NoDerivs license, for more details see here
| Reference: Kozlowski LP. Proteome-pI 2.0: Proteome Isoelectric Point Database Update. Nucleic Acids Res. 2021, doi: 10.1093/nar/gkab944 | Contact: Lukasz P. Kozlowski |