Prevotella sp. CAG:732
Taxonomy: cellular organisms; Bacteria; FCB group; Bacteroidetes/Chlorobi group; Bacteroidetes; Bacteroidia; Bacteroidales; Prevotellaceae; Prevotella; environmental samples
Average proteome isoelectric point is 6.42
Get precalculated fractions of proteins
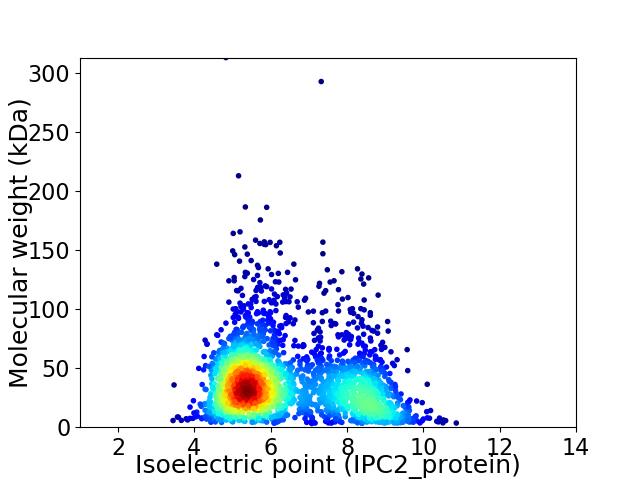
Virtual 2D-PAGE plot for 2409 proteins (isoelectric point calculated using IPC2_protein)
Get csv file with sequences according to given criteria:
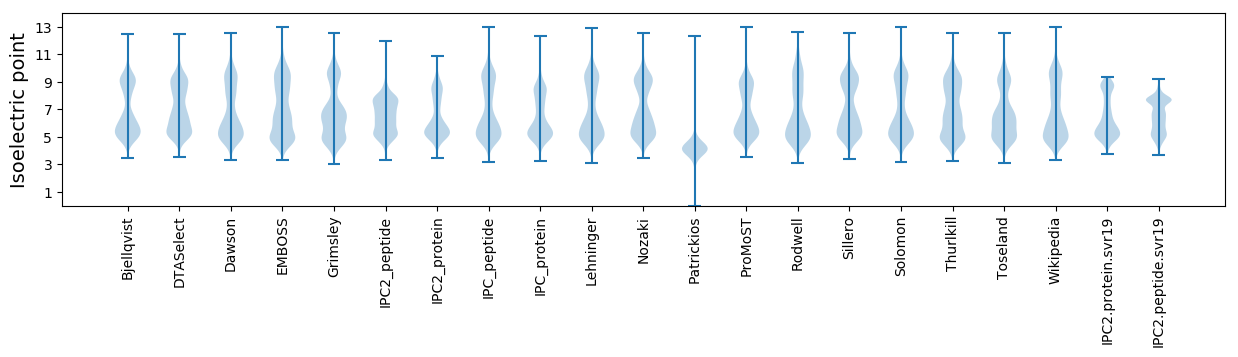
* You can choose from 21 different methods for calculating isoelectric point
Summary statistics related to proteome-wise predictions
Protein with the lowest isoelectric point:
>tr|R6X9E9|R6X9E9_9BACT Site-specific DNA-methyltransferase (adenine-specific) OS=Prevotella sp. CAG:732 OX=1262934 GN=BN769_01573 PE=3 SV=1
MM1 pKa = 7.41KK2 pKa = 10.04KK3 pKa = 10.07IYY5 pKa = 7.36MTPHH9 pKa = 7.52LEE11 pKa = 3.48ILAVVNSEE19 pKa = 4.03QLCDD23 pKa = 3.67GGGLYY28 pKa = 10.35GWSATNEE35 pKa = 4.13SDD37 pKa = 3.77GSSDD41 pKa = 4.25GGGSSDD47 pKa = 4.68NDD49 pKa = 3.64GDD51 pKa = 4.5PEE53 pKa = 4.3WGTAGAKK60 pKa = 10.34HH61 pKa = 5.87FDD63 pKa = 4.27CWNSWDD69 pKa = 3.9DD70 pKa = 3.42
MM1 pKa = 7.41KK2 pKa = 10.04KK3 pKa = 10.07IYY5 pKa = 7.36MTPHH9 pKa = 7.52LEE11 pKa = 3.48ILAVVNSEE19 pKa = 4.03QLCDD23 pKa = 3.67GGGLYY28 pKa = 10.35GWSATNEE35 pKa = 4.13SDD37 pKa = 3.77GSSDD41 pKa = 4.25GGGSSDD47 pKa = 4.68NDD49 pKa = 3.64GDD51 pKa = 4.5PEE53 pKa = 4.3WGTAGAKK60 pKa = 10.34HH61 pKa = 5.87FDD63 pKa = 4.27CWNSWDD69 pKa = 3.9DD70 pKa = 3.42
Molecular weight: 7.48 kDa
Isoelectric point according different methods:
Protein with the highest isoelectric point:
>tr|R6XBM2|R6XBM2_9BACT Uncharacterized protein OS=Prevotella sp. CAG:732 OX=1262934 GN=BN769_01886 PE=3 SV=1
MM1 pKa = 7.85PNGKK5 pKa = 9.19KK6 pKa = 10.25KK7 pKa = 10.12KK8 pKa = 7.0GHH10 pKa = 6.14KK11 pKa = 9.06MATHH15 pKa = 6.13KK16 pKa = 10.39RR17 pKa = 11.84KK18 pKa = 9.84KK19 pKa = 9.28RR20 pKa = 11.84LRR22 pKa = 11.84KK23 pKa = 9.25NRR25 pKa = 11.84HH26 pKa = 4.69KK27 pKa = 11.1SKK29 pKa = 11.1
MM1 pKa = 7.85PNGKK5 pKa = 9.19KK6 pKa = 10.25KK7 pKa = 10.12KK8 pKa = 7.0GHH10 pKa = 6.14KK11 pKa = 9.06MATHH15 pKa = 6.13KK16 pKa = 10.39RR17 pKa = 11.84KK18 pKa = 9.84KK19 pKa = 9.28RR20 pKa = 11.84LRR22 pKa = 11.84KK23 pKa = 9.25NRR25 pKa = 11.84HH26 pKa = 4.69KK27 pKa = 11.1SKK29 pKa = 11.1
Molecular weight: 3.54 kDa
Isoelectric point according different methods:
Peptides (in silico digests for buttom-up proteomics)
Below you can find in silico digests of the whole proteome with Trypsin, Chymotrypsin, Trypsin+LysC, LysN, ArgC proteases suitable for different mass spec machines.| Try ESI |
 |
|---|
| ChTry ESI |
|
|---|
| ArgC ESI |
|
|---|
| LysN ESI |
|
|---|
| TryLysC ESI |
|
|---|
| Try MALDI |
|
|---|
| ChTry MALDI |
|
|---|
| ArgC MALDI |
|
|---|
| LysN MALDI |
|
|---|
| TryLysC MALDI |
|
|---|
| Try LTQ |
|
|---|
| ChTry LTQ |
|
|---|
| ArgC LTQ |
|
|---|
| LysN LTQ |
|
|---|
| TryLysC LTQ |
|
|---|
| Try MSlow |
|
|---|
| ChTry MSlow |
|
|---|
| ArgC MSlow |
|
|---|
| LysN MSlow |
|
|---|
| TryLysC MSlow |
|
|---|
| Try MShigh |
|
|---|
| ChTry MShigh |
|
|---|
| ArgC MShigh |
|
|---|
| LysN MShigh |
|
|---|
| TryLysC MShigh |
|
|---|
General Statistics
Number of major isoforms |
Number of additional isoforms |
Number of all proteins |
Number of amino acids |
Min. Seq. Length |
Max. Seq. Length |
Avg. Seq. Length |
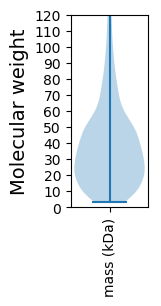
Avg. Mol. Weight |
|---|---|---|---|---|---|---|---|
0 |
864167 |
29 |
2859 |
358.7 |
40.43 |
Amino acid frequency
Ala |
Cys |
Asp |
Glu |
Phe |
Gly |
His |
Ile |
Lys |
Leu |
|---|---|---|---|---|---|---|---|---|---|
7.263 ± 0.038 | 1.304 ± 0.017 |
5.954 ± 0.037 | 6.302 ± 0.048 |
4.391 ± 0.031 | 6.911 ± 0.042 |
2.09 ± 0.022 | 6.541 ± 0.043 |
7.132 ± 0.037 | 8.654 ± 0.049 |
Met |
Asn |
Gln |
Pro |
Arg |
Ser |
Thr |
Val |
Trp |
Tyr |
|---|---|---|---|---|---|---|---|---|---|
2.98 ± 0.027 | 5.237 ± 0.048 |
3.518 ± 0.026 | 3.657 ± 0.025 |
4.174 ± 0.031 | 6.08 ± 0.042 |
5.616 ± 0.046 | 6.45 ± 0.038 |
1.34 ± 0.018 | 4.402 ± 0.04 |
Most of the basic statistics you can see at this page can be downloaded from this CSV file
See this proteome in:

Proteome-pI is available under Creative Commons Attribution-NoDerivs license, for more details see here
| Reference: Kozlowski LP. Proteome-pI 2.0: Proteome Isoelectric Point Database Update. Nucleic Acids Res. 2021, doi: 10.1093/nar/gkab944 | Contact: Lukasz P. Kozlowski |