Acidianus brierleyi
Taxonomy: cellular organisms; Archaea; TACK group; Crenarchaeota; Thermoprotei; Sulfolobales; Sulfolobaceae; Acidianus
Average proteome isoelectric point is 6.89
Get precalculated fractions of proteins
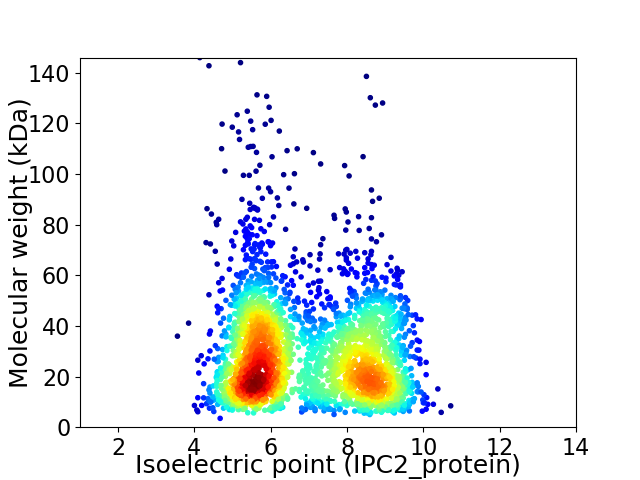
Virtual 2D-PAGE plot for 2858 proteins (isoelectric point calculated using IPC2_protein)
Get csv file with sequences according to given criteria:
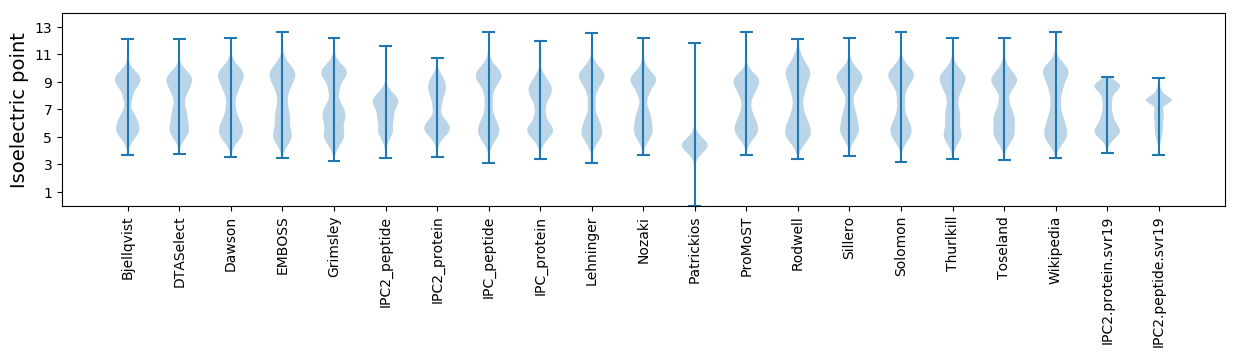
* You can choose from 21 different methods for calculating isoelectric point
Summary statistics related to proteome-wise predictions
Protein with the lowest isoelectric point:
>tr|A0A2U9IE46|A0A2U9IE46_9CREN ABC transporter ATP-binding protein OS=Acidianus brierleyi OX=41673 GN=DFR85_06280 PE=4 SV=1
MM1 pKa = 6.95VTLKK5 pKa = 11.0CPVCGGNINLEE16 pKa = 4.13DD17 pKa = 4.27DD18 pKa = 4.31ALPGEE23 pKa = 4.69IIEE26 pKa = 4.8HH27 pKa = 5.89EE28 pKa = 4.52CGAQLEE34 pKa = 4.8VYY36 pKa = 10.26NDD38 pKa = 3.48NGRR41 pKa = 11.84LALRR45 pKa = 11.84LAEE48 pKa = 4.3QVGEE52 pKa = 4.26DD53 pKa = 3.07WGEE56 pKa = 3.62
MM1 pKa = 6.95VTLKK5 pKa = 11.0CPVCGGNINLEE16 pKa = 4.13DD17 pKa = 4.27DD18 pKa = 4.31ALPGEE23 pKa = 4.69IIEE26 pKa = 4.8HH27 pKa = 5.89EE28 pKa = 4.52CGAQLEE34 pKa = 4.8VYY36 pKa = 10.26NDD38 pKa = 3.48NGRR41 pKa = 11.84LALRR45 pKa = 11.84LAEE48 pKa = 4.3QVGEE52 pKa = 4.26DD53 pKa = 3.07WGEE56 pKa = 3.62
Molecular weight: 6.1 kDa
Isoelectric point according different methods:
Protein with the highest isoelectric point:
>tr|A0A2U9IEK8|A0A2U9IEK8_9CREN Peptidyl-prolyl cis-trans isomerase OS=Acidianus brierleyi OX=41673 GN=DFR85_07320 PE=3 SV=1
MM1 pKa = 7.66KK2 pKa = 8.54GTPSFGKK9 pKa = 9.49MNNNYY14 pKa = 7.14THH16 pKa = 6.5IRR18 pKa = 11.84CRR20 pKa = 11.84RR21 pKa = 11.84CGRR24 pKa = 11.84NSYY27 pKa = 10.77NVTKK31 pKa = 9.77HH32 pKa = 4.91YY33 pKa = 10.59CAACGFGKK41 pKa = 9.85SKK43 pKa = 10.68RR44 pKa = 11.84IRR46 pKa = 11.84SYY48 pKa = 9.35SWQNKK53 pKa = 7.17KK54 pKa = 10.49VNGVRR59 pKa = 11.84IKK61 pKa = 10.94
MM1 pKa = 7.66KK2 pKa = 8.54GTPSFGKK9 pKa = 9.49MNNNYY14 pKa = 7.14THH16 pKa = 6.5IRR18 pKa = 11.84CRR20 pKa = 11.84RR21 pKa = 11.84CGRR24 pKa = 11.84NSYY27 pKa = 10.77NVTKK31 pKa = 9.77HH32 pKa = 4.91YY33 pKa = 10.59CAACGFGKK41 pKa = 9.85SKK43 pKa = 10.68RR44 pKa = 11.84IRR46 pKa = 11.84SYY48 pKa = 9.35SWQNKK53 pKa = 7.17KK54 pKa = 10.49VNGVRR59 pKa = 11.84IKK61 pKa = 10.94
Molecular weight: 7.1 kDa
Isoelectric point according different methods:
Peptides (in silico digests for buttom-up proteomics)
Below you can find in silico digests of the whole proteome with Trypsin, Chymotrypsin, Trypsin+LysC, LysN, ArgC proteases suitable for different mass spec machines.| Try ESI |
 |
|---|
| ChTry ESI |
|
|---|
| ArgC ESI |
|
|---|
| LysN ESI |
|
|---|
| TryLysC ESI |
|
|---|
| Try MALDI |
|
|---|
| ChTry MALDI |
|
|---|
| ArgC MALDI |
|
|---|
| LysN MALDI |
|
|---|
| TryLysC MALDI |
|
|---|
| Try LTQ |
|
|---|
| ChTry LTQ |
|
|---|
| ArgC LTQ |
|
|---|
| LysN LTQ |
|
|---|
| TryLysC LTQ |
|
|---|
| Try MSlow |
|
|---|
| ChTry MSlow |
|
|---|
| ArgC MSlow |
|
|---|
| LysN MSlow |
|
|---|
| TryLysC MSlow |
|
|---|
| Try MShigh |
|
|---|
| ChTry MShigh |
|
|---|
| ArgC MShigh |
|
|---|
| LysN MShigh |
|
|---|
| TryLysC MShigh |
|
|---|
General Statistics
Number of major isoforms |
Number of additional isoforms |
Number of all proteins |
Number of amino acids |
Min. Seq. Length |
Max. Seq. Length |
Avg. Seq. Length |
Avg. Mol. Weight |
|---|---|---|---|---|---|---|---|
0 |
790434 |
32 |
1361 |
276.6 |
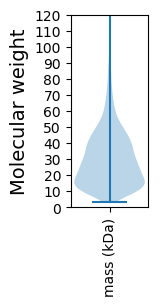
31.3 |
Amino acid frequency
Ala |
Cys |
Asp |
Glu |
Phe |
Gly |
His |
Ile |
Lys |
Leu |
|---|---|---|---|---|---|---|---|---|---|
5.432 ± 0.043 | 0.664 ± 0.016 |
4.941 ± 0.046 | 6.666 ± 0.06 |
4.719 ± 0.041 | 6.422 ± 0.042 |
1.257 ± 0.016 | 10.491 ± 0.065 |
8.105 ± 0.066 | 9.853 ± 0.054 |
Met |
Asn |
Gln |
Pro |
Arg |
Ser |
Thr |
Val |
Trp |
Tyr |
|---|---|---|---|---|---|---|---|---|---|
2.298 ± 0.021 | 5.418 ± 0.036 |
3.803 ± 0.031 | 2.002 ± 0.025 |
3.803 ± 0.037 | 7.151 ± 0.038 |
4.679 ± 0.036 | 6.469 ± 0.032 |
1.017 ± 0.019 | 4.81 ± 0.034 |
Most of the basic statistics you can see at this page can be downloaded from this CSV file
See this proteome in:

Proteome-pI is available under Creative Commons Attribution-NoDerivs license, for more details see here
| Reference: Kozlowski LP. Proteome-pI 2.0: Proteome Isoelectric Point Database Update. Nucleic Acids Res. 2021, doi: 10.1093/nar/gkab944 | Contact: Lukasz P. Kozlowski |