Pseudomonas sp. HPB0071
Taxonomy: cellular organisms; Bacteria; Proteobacteria; Gammaproteobacteria; Pseudomonadales; Pseudomonadaceae; Pseudomonas; unclassified Pseudomonas
Average proteome isoelectric point is 6.42
Get precalculated fractions of proteins
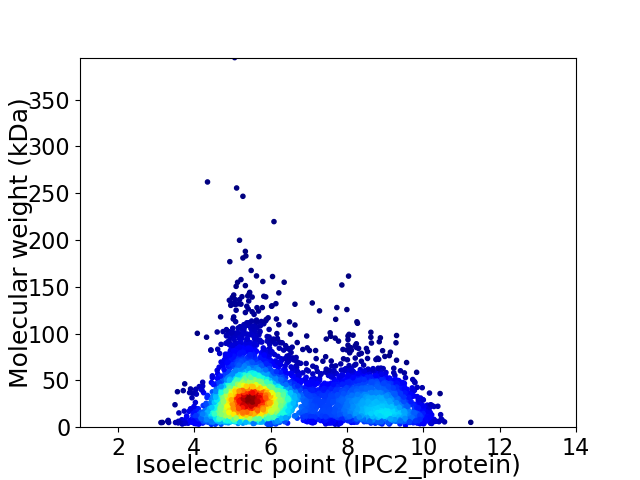
Virtual 2D-PAGE plot for 5313 proteins (isoelectric point calculated using IPC2_protein)
Get csv file with sequences according to given criteria:
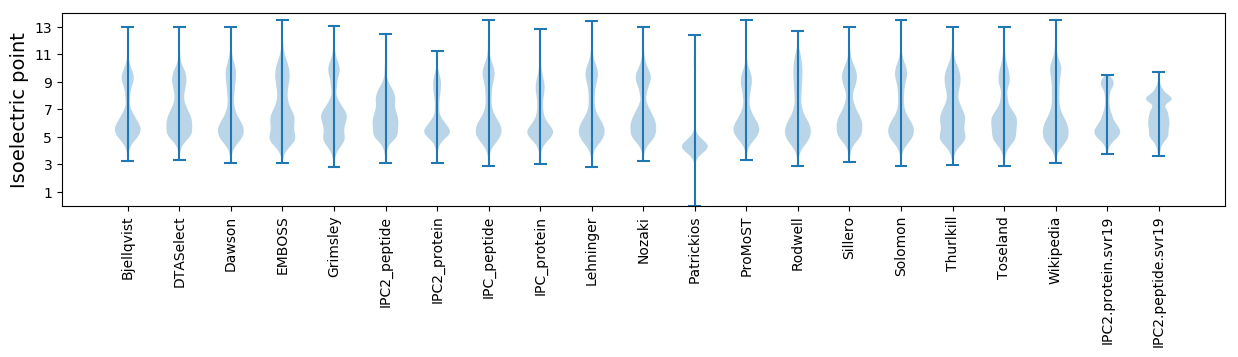
* You can choose from 21 different methods for calculating isoelectric point
Summary statistics related to proteome-wise predictions


Protein with the lowest isoelectric point:
>tr|N2J9P3|N2J9P3_9PSED Uncharacterized protein OS=Pseudomonas sp. HPB0071 OX=1203578 GN=HMPREF1487_06393 PE=4 SV=1
MM1 pKa = 7.83RR2 pKa = 11.84KK3 pKa = 7.57WQCIVCGYY11 pKa = 10.24IYY13 pKa = 10.51DD14 pKa = 4.41EE15 pKa = 4.39AAGWPDD21 pKa = 4.33DD22 pKa = 4.61GIAPGTRR29 pKa = 11.84WEE31 pKa = 4.73DD32 pKa = 3.6VPEE35 pKa = 4.61DD36 pKa = 4.12WMCPDD41 pKa = 4.18CGVGKK46 pKa = 10.46SDD48 pKa = 4.34FEE50 pKa = 4.49MIEE53 pKa = 3.92IAA55 pKa = 5.16
MM1 pKa = 7.83RR2 pKa = 11.84KK3 pKa = 7.57WQCIVCGYY11 pKa = 10.24IYY13 pKa = 10.51DD14 pKa = 4.41EE15 pKa = 4.39AAGWPDD21 pKa = 4.33DD22 pKa = 4.61GIAPGTRR29 pKa = 11.84WEE31 pKa = 4.73DD32 pKa = 3.6VPEE35 pKa = 4.61DD36 pKa = 4.12WMCPDD41 pKa = 4.18CGVGKK46 pKa = 10.46SDD48 pKa = 4.34FEE50 pKa = 4.49MIEE53 pKa = 3.92IAA55 pKa = 5.16
Molecular weight: 6.26 kDa
Isoelectric point according different methods:
Protein with the highest isoelectric point:
>tr|N2J392|N2J392_9PSED S-formylglutathione hydrolase OS=Pseudomonas sp. HPB0071 OX=1203578 GN=HMPREF1487_07231 PE=3 SV=1
MM1 pKa = 7.45KK2 pKa = 9.56RR3 pKa = 11.84TFQPSTLKK11 pKa = 10.52RR12 pKa = 11.84ARR14 pKa = 11.84THH16 pKa = 5.94GFRR19 pKa = 11.84ARR21 pKa = 11.84MATKK25 pKa = 10.29NGRR28 pKa = 11.84QVLSRR33 pKa = 11.84RR34 pKa = 11.84RR35 pKa = 11.84AKK37 pKa = 9.94GRR39 pKa = 11.84KK40 pKa = 8.66RR41 pKa = 11.84LAVV44 pKa = 3.41
MM1 pKa = 7.45KK2 pKa = 9.56RR3 pKa = 11.84TFQPSTLKK11 pKa = 10.52RR12 pKa = 11.84ARR14 pKa = 11.84THH16 pKa = 5.94GFRR19 pKa = 11.84ARR21 pKa = 11.84MATKK25 pKa = 10.29NGRR28 pKa = 11.84QVLSRR33 pKa = 11.84RR34 pKa = 11.84RR35 pKa = 11.84AKK37 pKa = 9.94GRR39 pKa = 11.84KK40 pKa = 8.66RR41 pKa = 11.84LAVV44 pKa = 3.41
Molecular weight: 5.18 kDa
Isoelectric point according different methods:
Peptides (in silico digests for buttom-up proteomics)
Below you can find in silico digests of the whole proteome with Trypsin, Chymotrypsin, Trypsin+LysC, LysN, ArgC proteases suitable for different mass spec machines.| Try ESI |
 |
|---|
| ChTry ESI |
|
|---|
| ArgC ESI |
|
|---|
| LysN ESI |
|
|---|
| TryLysC ESI |
|
|---|
| Try MALDI |
|
|---|
| ChTry MALDI |
|
|---|
| ArgC MALDI |
|
|---|
| LysN MALDI |
|
|---|
| TryLysC MALDI |
|
|---|
| Try LTQ |
|
|---|
| ChTry LTQ |
|
|---|
| ArgC LTQ |
|
|---|
| LysN LTQ |
|
|---|
| TryLysC LTQ |
|
|---|
| Try MSlow |
|
|---|
| ChTry MSlow |
|
|---|
| ArgC MSlow |
|
|---|
| LysN MSlow |
|
|---|
| TryLysC MSlow |
|
|---|
| Try MShigh |
|
|---|
| ChTry MShigh |
|
|---|
| ArgC MShigh |
|
|---|
| LysN MShigh |
|
|---|
| TryLysC MShigh |
|
|---|
General Statistics
Number of major isoforms |
Number of additional isoforms |
Number of all proteins |
Number of amino acids |
Min. Seq. Length |
Max. Seq. Length |
Avg. Seq. Length |
Avg. Mol. Weight |
|---|---|---|---|---|---|---|---|
0 |
1648862 |
20 |
3543 |
310.3 |
34.21 |
Amino acid frequency
Ala |
Cys |
Asp |
Glu |
Phe |
Gly |
His |
Ile |
Lys |
Leu |
|---|---|---|---|---|---|---|---|---|---|
10.389 ± 0.035 | 1.001 ± 0.011 |
5.27 ± 0.027 | 6.062 ± 0.033 |
3.649 ± 0.024 | 7.591 ± 0.029 |
2.324 ± 0.016 | 5.206 ± 0.023 |
3.724 ± 0.026 | 11.336 ± 0.054 |
Met |
Asn |
Gln |
Pro |
Arg |
Ser |
Thr |
Val |
Trp |
Tyr |
|---|---|---|---|---|---|---|---|---|---|
2.421 ± 0.016 | 3.161 ± 0.022 |
4.783 ± 0.027 | 4.399 ± 0.028 |
6.424 ± 0.032 | 6.003 ± 0.028 |
5.224 ± 0.021 | 6.938 ± 0.029 |
1.426 ± 0.014 | 2.67 ± 0.021 |
Most of the basic statistics you can see at this page can be downloaded from this CSV file
See this proteome in:

Proteome-pI is available under Creative Commons Attribution-NoDerivs license, for more details see here
| Reference: Kozlowski LP. Proteome-pI 2.0: Proteome Isoelectric Point Database Update. Nucleic Acids Res. 2021, doi: 10.1093/nar/gkab944 | Contact: Lukasz P. Kozlowski |