Methylobacterium sp. Leaf99
Taxonomy: cellular organisms; Bacteria; Proteobacteria; Alphaproteobacteria; Hyphomicrobiales; Methylobacteriaceae; Methylobacterium; unclassified Methylobacterium
Average proteome isoelectric point is 6.86
Get precalculated fractions of proteins
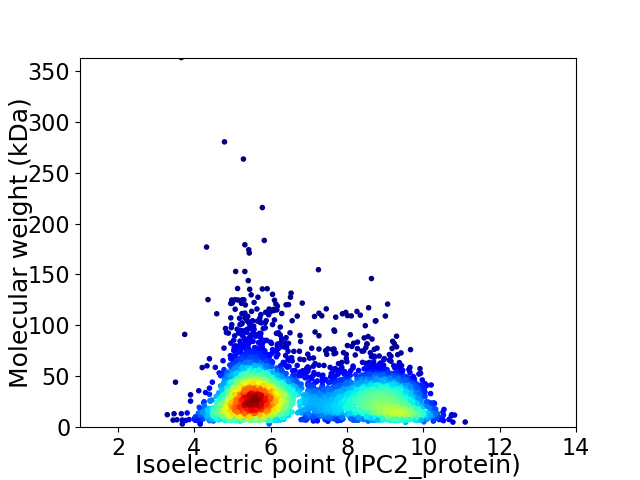
Virtual 2D-PAGE plot for 4109 proteins (isoelectric point calculated using IPC2_protein)
Get csv file with sequences according to given criteria:
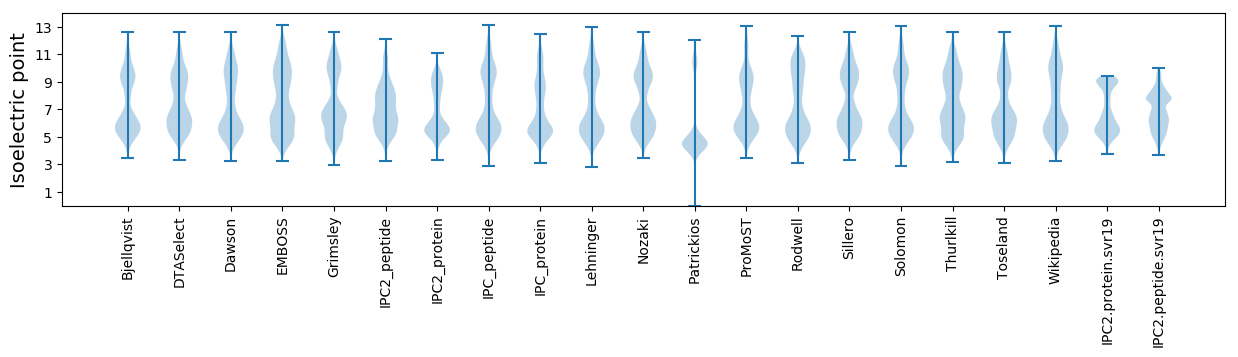
* You can choose from 21 different methods for calculating isoelectric point
Summary statistics related to proteome-wise predictions
Protein with the lowest isoelectric point:
>tr|A0A0Q4XWP5|A0A0Q4XWP5_9RHIZ ATP-dependent Clp protease proteolytic subunit OS=Methylobacterium sp. Leaf99 OX=1736251 GN=ASF28_08965 PE=3 SV=1
MM1 pKa = 7.57LEE3 pKa = 4.76SIPAGWPCALLPAEE17 pKa = 4.84PPSVADD23 pKa = 3.98RR24 pKa = 11.84QSNPSADD31 pKa = 3.93EE32 pKa = 3.82ILPQVLALTPRR43 pKa = 11.84GAAWGADD50 pKa = 3.31EE51 pKa = 5.96AGDD54 pKa = 3.9GKK56 pKa = 10.89GASPVQRR63 pKa = 11.84SFWRR67 pKa = 11.84GIAAWVADD75 pKa = 4.12LNIRR79 pKa = 11.84DD80 pKa = 3.81WTIATQTFPSAATVSLPDD98 pKa = 3.35WEE100 pKa = 5.85AEE102 pKa = 4.03LGLPDD107 pKa = 3.83PCMPAGRR114 pKa = 11.84TAEE117 pKa = 3.9QRR119 pKa = 11.84VSRR122 pKa = 11.84VRR124 pKa = 11.84ARR126 pKa = 11.84FGAQGGASPAYY137 pKa = 8.3FVCVAASLGFTMRR150 pKa = 11.84VEE152 pKa = 4.23EE153 pKa = 4.28PTQFLCDD160 pKa = 3.47VSEE163 pKa = 4.53CVAFDD168 pKa = 3.59TLDD171 pKa = 3.29TYY173 pKa = 7.52FTCDD177 pKa = 3.09EE178 pKa = 4.68AEE180 pKa = 4.4CGEE183 pKa = 4.88DD184 pKa = 3.52GDD186 pKa = 4.92PIEE189 pKa = 5.93GYY191 pKa = 10.49AFPSAADD198 pKa = 3.97PGDD201 pKa = 3.88EE202 pKa = 4.33VAGGALNEE210 pKa = 4.52TYY212 pKa = 10.13FACDD216 pKa = 3.03EE217 pKa = 4.66GEE219 pKa = 4.26CGEE222 pKa = 4.76DD223 pKa = 3.48GDD225 pKa = 4.9RR226 pKa = 11.84IEE228 pKa = 6.07GFDD231 pKa = 4.17PNDD234 pKa = 3.95PGAVAWRR241 pKa = 11.84FWVADD246 pKa = 3.7VVTAPATYY254 pKa = 9.91FRR256 pKa = 11.84CDD258 pKa = 3.22EE259 pKa = 4.49AEE261 pKa = 4.42CGAEE265 pKa = 3.86GDD267 pKa = 4.2RR268 pKa = 11.84IEE270 pKa = 5.66GYY272 pKa = 8.66TPAPDD277 pKa = 4.17LEE279 pKa = 4.6CVLARR284 pKa = 11.84LSPPHH289 pKa = 5.31TTLVFRR295 pKa = 11.84YY296 pKa = 9.24PDD298 pKa = 3.03
MM1 pKa = 7.57LEE3 pKa = 4.76SIPAGWPCALLPAEE17 pKa = 4.84PPSVADD23 pKa = 3.98RR24 pKa = 11.84QSNPSADD31 pKa = 3.93EE32 pKa = 3.82ILPQVLALTPRR43 pKa = 11.84GAAWGADD50 pKa = 3.31EE51 pKa = 5.96AGDD54 pKa = 3.9GKK56 pKa = 10.89GASPVQRR63 pKa = 11.84SFWRR67 pKa = 11.84GIAAWVADD75 pKa = 4.12LNIRR79 pKa = 11.84DD80 pKa = 3.81WTIATQTFPSAATVSLPDD98 pKa = 3.35WEE100 pKa = 5.85AEE102 pKa = 4.03LGLPDD107 pKa = 3.83PCMPAGRR114 pKa = 11.84TAEE117 pKa = 3.9QRR119 pKa = 11.84VSRR122 pKa = 11.84VRR124 pKa = 11.84ARR126 pKa = 11.84FGAQGGASPAYY137 pKa = 8.3FVCVAASLGFTMRR150 pKa = 11.84VEE152 pKa = 4.23EE153 pKa = 4.28PTQFLCDD160 pKa = 3.47VSEE163 pKa = 4.53CVAFDD168 pKa = 3.59TLDD171 pKa = 3.29TYY173 pKa = 7.52FTCDD177 pKa = 3.09EE178 pKa = 4.68AEE180 pKa = 4.4CGEE183 pKa = 4.88DD184 pKa = 3.52GDD186 pKa = 4.92PIEE189 pKa = 5.93GYY191 pKa = 10.49AFPSAADD198 pKa = 3.97PGDD201 pKa = 3.88EE202 pKa = 4.33VAGGALNEE210 pKa = 4.52TYY212 pKa = 10.13FACDD216 pKa = 3.03EE217 pKa = 4.66GEE219 pKa = 4.26CGEE222 pKa = 4.76DD223 pKa = 3.48GDD225 pKa = 4.9RR226 pKa = 11.84IEE228 pKa = 6.07GFDD231 pKa = 4.17PNDD234 pKa = 3.95PGAVAWRR241 pKa = 11.84FWVADD246 pKa = 3.7VVTAPATYY254 pKa = 9.91FRR256 pKa = 11.84CDD258 pKa = 3.22EE259 pKa = 4.49AEE261 pKa = 4.42CGAEE265 pKa = 3.86GDD267 pKa = 4.2RR268 pKa = 11.84IEE270 pKa = 5.66GYY272 pKa = 8.66TPAPDD277 pKa = 4.17LEE279 pKa = 4.6CVLARR284 pKa = 11.84LSPPHH289 pKa = 5.31TTLVFRR295 pKa = 11.84YY296 pKa = 9.24PDD298 pKa = 3.03
Molecular weight: 31.82 kDa
Isoelectric point according different methods:
Protein with the highest isoelectric point:
>tr|A0A0Q4XPX2|A0A0Q4XPX2_9RHIZ General stress protein CsbD OS=Methylobacterium sp. Leaf99 OX=1736251 GN=ASF28_02825 PE=3 SV=1
MM1 pKa = 7.35KK2 pKa = 9.43RR3 pKa = 11.84TYY5 pKa = 10.27QPSKK9 pKa = 9.73LVRR12 pKa = 11.84KK13 pKa = 9.15RR14 pKa = 11.84RR15 pKa = 11.84HH16 pKa = 4.42GFRR19 pKa = 11.84ARR21 pKa = 11.84MATAGGRR28 pKa = 11.84KK29 pKa = 9.07VIAARR34 pKa = 11.84RR35 pKa = 11.84SHH37 pKa = 5.5GRR39 pKa = 11.84KK40 pKa = 9.35KK41 pKa = 10.69LSAA44 pKa = 3.99
MM1 pKa = 7.35KK2 pKa = 9.43RR3 pKa = 11.84TYY5 pKa = 10.27QPSKK9 pKa = 9.73LVRR12 pKa = 11.84KK13 pKa = 9.15RR14 pKa = 11.84RR15 pKa = 11.84HH16 pKa = 4.42GFRR19 pKa = 11.84ARR21 pKa = 11.84MATAGGRR28 pKa = 11.84KK29 pKa = 9.07VIAARR34 pKa = 11.84RR35 pKa = 11.84SHH37 pKa = 5.5GRR39 pKa = 11.84KK40 pKa = 9.35KK41 pKa = 10.69LSAA44 pKa = 3.99
Molecular weight: 5.08 kDa
Isoelectric point according different methods:
Peptides (in silico digests for buttom-up proteomics)
Below you can find in silico digests of the whole proteome with Trypsin, Chymotrypsin, Trypsin+LysC, LysN, ArgC proteases suitable for different mass spec machines.| Try ESI |
 |
|---|
| ChTry ESI |
|
|---|
| ArgC ESI |
|
|---|
| LysN ESI |
|
|---|
| TryLysC ESI |
|
|---|
| Try MALDI |
|
|---|
| ChTry MALDI |
|
|---|
| ArgC MALDI |
|
|---|
| LysN MALDI |
|
|---|
| TryLysC MALDI |
|
|---|
| Try LTQ |
|
|---|
| ChTry LTQ |
|
|---|
| ArgC LTQ |
|
|---|
| LysN LTQ |
|
|---|
| TryLysC LTQ |
|
|---|
| Try MSlow |
|
|---|
| ChTry MSlow |
|
|---|
| ArgC MSlow |
|
|---|
| LysN MSlow |
|
|---|
| TryLysC MSlow |
|
|---|
| Try MShigh |
|
|---|
| ChTry MShigh |
|
|---|
| ArgC MShigh |
|
|---|
| LysN MShigh |
|
|---|
| TryLysC MShigh |
|
|---|
General Statistics
Number of major isoforms |
Number of additional isoforms |
Number of all proteins |
Number of amino acids |
Min. Seq. Length |
Max. Seq. Length |
Avg. Seq. Length |
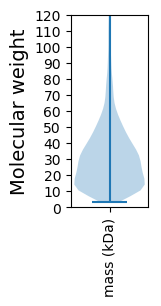
Avg. Mol. Weight |
|---|---|---|---|---|---|---|---|
0 |
1270044 |
29 |
3736 |
309.1 |
33.08 |
Amino acid frequency
Ala |
Cys |
Asp |
Glu |
Phe |
Gly |
His |
Ile |
Lys |
Leu |
|---|---|---|---|---|---|---|---|---|---|
14.375 ± 0.056 | 0.774 ± 0.013 |
5.741 ± 0.028 | 5.255 ± 0.04 |
3.388 ± 0.026 | 9.236 ± 0.046 |
1.968 ± 0.021 | 4.405 ± 0.026 |
2.542 ± 0.032 | 10.393 ± 0.044 |
Met |
Asn |
Gln |
Pro |
Arg |
Ser |
Thr |
Val |
Trp |
Tyr |
|---|---|---|---|---|---|---|---|---|---|
2.04 ± 0.018 | 2.1 ± 0.024 |
5.796 ± 0.032 | 2.636 ± 0.025 |
7.983 ± 0.045 | 4.74 ± 0.027 |
5.671 ± 0.04 | 7.761 ± 0.031 |
1.204 ± 0.017 | 1.991 ± 0.02 |
Most of the basic statistics you can see at this page can be downloaded from this CSV file
See this proteome in:

Proteome-pI is available under Creative Commons Attribution-NoDerivs license, for more details see here
| Reference: Kozlowski LP. Proteome-pI 2.0: Proteome Isoelectric Point Database Update. Nucleic Acids Res. 2021, doi: 10.1093/nar/gkab944 | Contact: Lukasz P. Kozlowski |