Sphingomonas sp. XS-10
Taxonomy: cellular organisms; Bacteria; Proteobacteria; Alphaproteobacteria; Sphingomonadales; Sphingomonadaceae; Sphingomonas; unclassified Sphingomonas
Average proteome isoelectric point is 6.58
Get precalculated fractions of proteins
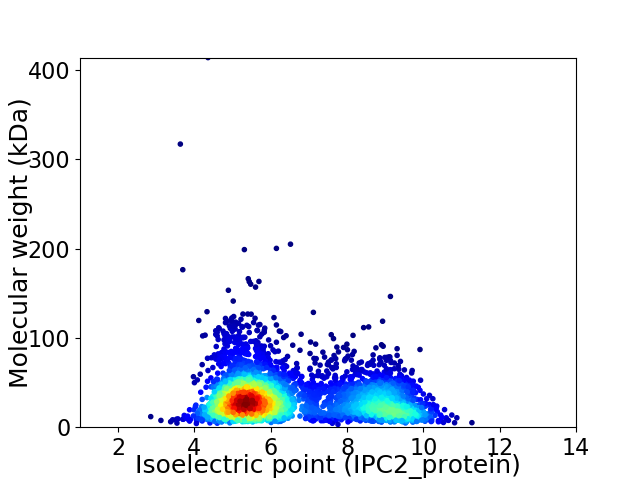
Virtual 2D-PAGE plot for 3831 proteins (isoelectric point calculated using IPC2_protein)
Get csv file with sequences according to given criteria:
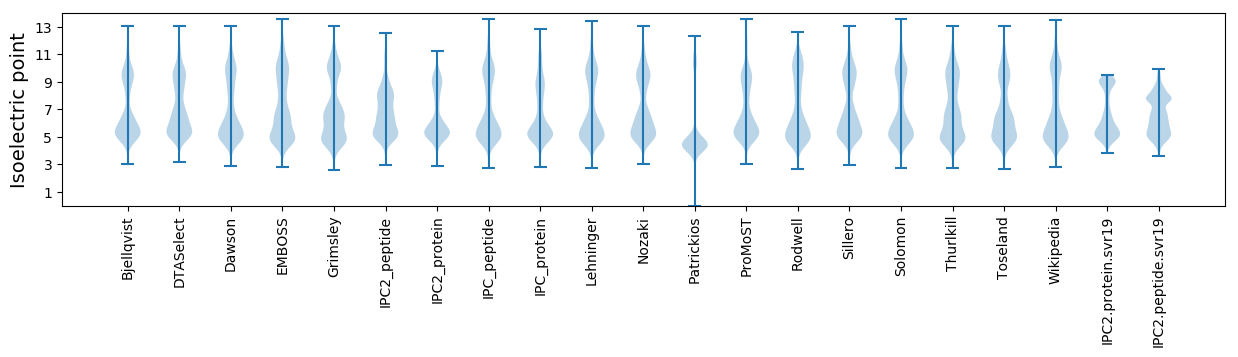
* You can choose from 21 different methods for calculating isoelectric point
Summary statistics related to proteome-wise predictions
Protein with the lowest isoelectric point:
>tr|A0A518RJI6|A0A518RJI6_9SPHN Ribosomal RNA large subunit methyltransferase H OS=Sphingomonas sp. XS-10 OX=2599297 GN=rlmH PE=3 SV=1
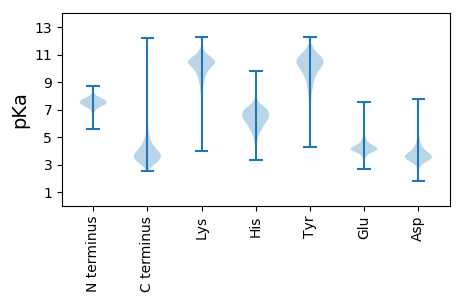
MM1 pKa = 7.32RR2 pKa = 11.84HH3 pKa = 5.35KK4 pKa = 9.65TLFSLIALCGSTAAVAAIGTPQTEE28 pKa = 4.14PPLQNDD34 pKa = 3.75IANEE38 pKa = 3.93ATPAPDD44 pKa = 5.36DD45 pKa = 3.54MTAPEE50 pKa = 4.27TMSNSTDD57 pKa = 3.36VEE59 pKa = 4.21PSMEE63 pKa = 4.25PAEE66 pKa = 4.38PADD69 pKa = 3.68PTEE72 pKa = 5.25DD73 pKa = 3.49GSEE76 pKa = 4.07TSPEE80 pKa = 3.85PNAAYY85 pKa = 10.34YY86 pKa = 10.49
MM1 pKa = 7.32RR2 pKa = 11.84HH3 pKa = 5.35KK4 pKa = 9.65TLFSLIALCGSTAAVAAIGTPQTEE28 pKa = 4.14PPLQNDD34 pKa = 3.75IANEE38 pKa = 3.93ATPAPDD44 pKa = 5.36DD45 pKa = 3.54MTAPEE50 pKa = 4.27TMSNSTDD57 pKa = 3.36VEE59 pKa = 4.21PSMEE63 pKa = 4.25PAEE66 pKa = 4.38PADD69 pKa = 3.68PTEE72 pKa = 5.25DD73 pKa = 3.49GSEE76 pKa = 4.07TSPEE80 pKa = 3.85PNAAYY85 pKa = 10.34YY86 pKa = 10.49
Molecular weight: 8.98 kDa
Isoelectric point according different methods:
Protein with the highest isoelectric point:
>tr|A0A518RED7|A0A518RED7_9SPHN Uncharacterized protein OS=Sphingomonas sp. XS-10 OX=2599297 GN=FPZ54_07120 PE=4 SV=1
MM1 pKa = 7.45KK2 pKa = 9.61RR3 pKa = 11.84TFQPSNLVRR12 pKa = 11.84ARR14 pKa = 11.84RR15 pKa = 11.84HH16 pKa = 4.37GFRR19 pKa = 11.84ARR21 pKa = 11.84MATPGGRR28 pKa = 11.84NVIRR32 pKa = 11.84ARR34 pKa = 11.84RR35 pKa = 11.84ARR37 pKa = 11.84GRR39 pKa = 11.84NKK41 pKa = 10.45LSAA44 pKa = 3.94
MM1 pKa = 7.45KK2 pKa = 9.61RR3 pKa = 11.84TFQPSNLVRR12 pKa = 11.84ARR14 pKa = 11.84RR15 pKa = 11.84HH16 pKa = 4.37GFRR19 pKa = 11.84ARR21 pKa = 11.84MATPGGRR28 pKa = 11.84NVIRR32 pKa = 11.84ARR34 pKa = 11.84RR35 pKa = 11.84ARR37 pKa = 11.84GRR39 pKa = 11.84NKK41 pKa = 10.45LSAA44 pKa = 3.94
Molecular weight: 5.08 kDa
Isoelectric point according different methods:
Peptides (in silico digests for buttom-up proteomics)
Below you can find in silico digests of the whole proteome with Trypsin, Chymotrypsin, Trypsin+LysC, LysN, ArgC proteases suitable for different mass spec machines.| Try ESI |
 |
|---|
| ChTry ESI |
|
|---|
| ArgC ESI |
|
|---|
| LysN ESI |
|
|---|
| TryLysC ESI |
|
|---|
| Try MALDI |
|
|---|
| ChTry MALDI |
|
|---|
| ArgC MALDI |
|
|---|
| LysN MALDI |
|
|---|
| TryLysC MALDI |
|
|---|
| Try LTQ |
|
|---|
| ChTry LTQ |
|
|---|
| ArgC LTQ |
|
|---|
| LysN LTQ |
|
|---|
| TryLysC LTQ |
|
|---|
| Try MSlow |
|
|---|
| ChTry MSlow |
|
|---|
| ArgC MSlow |
|
|---|
| LysN MSlow |
|
|---|
| TryLysC MSlow |
|
|---|
| Try MShigh |
|
|---|
| ChTry MShigh |
|
|---|
| ArgC MShigh |
|
|---|
| LysN MShigh |
|
|---|
| TryLysC MShigh |
|
|---|
General Statistics
Number of major isoforms |
Number of additional isoforms |
Number of all proteins |
Number of amino acids |
Min. Seq. Length |
Max. Seq. Length |
Avg. Seq. Length |
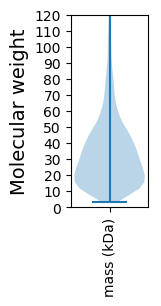
Avg. Mol. Weight |
|---|---|---|---|---|---|---|---|
0 |
1241582 |
29 |
3971 |
324.1 |
34.98 |
Amino acid frequency
Ala |
Cys |
Asp |
Glu |
Phe |
Gly |
His |
Ile |
Lys |
Leu |
|---|---|---|---|---|---|---|---|---|---|
13.661 ± 0.062 | 0.718 ± 0.01 |
6.081 ± 0.03 | 5.348 ± 0.039 |
3.55 ± 0.026 | 8.949 ± 0.037 |
1.878 ± 0.021 | 4.968 ± 0.025 |
2.832 ± 0.032 | 9.754 ± 0.044 |
Met |
Asn |
Gln |
Pro |
Arg |
Ser |
Thr |
Val |
Trp |
Tyr |
|---|---|---|---|---|---|---|---|---|---|
2.357 ± 0.02 | 2.458 ± 0.025 |
5.487 ± 0.036 | 3.012 ± 0.021 |
7.607 ± 0.046 | 5.063 ± 0.029 |
5.385 ± 0.032 | 7.178 ± 0.032 |
1.486 ± 0.015 | 2.228 ± 0.022 |
Most of the basic statistics you can see at this page can be downloaded from this CSV file
See this proteome in:

Proteome-pI is available under Creative Commons Attribution-NoDerivs license, for more details see here
| Reference: Kozlowski LP. Proteome-pI 2.0: Proteome Isoelectric Point Database Update. Nucleic Acids Res. 2021, doi: 10.1093/nar/gkab944 | Contact: Lukasz P. Kozlowski |