Citrobacter virus HCF1
Taxonomy: Viruses; Duplodnaviria; Heunggongvirae; Uroviricota; Caudoviricetes; Caudovirales; Drexlerviridae; Hicfunavirus
Average proteome isoelectric point is 7.09
Get precalculated fractions of proteins
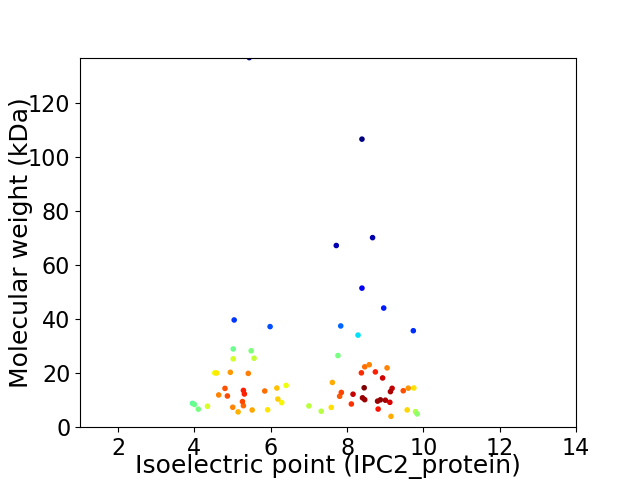
Virtual 2D-PAGE plot for 71 proteins (isoelectric point calculated using IPC2_protein)
Get csv file with sequences according to given criteria:
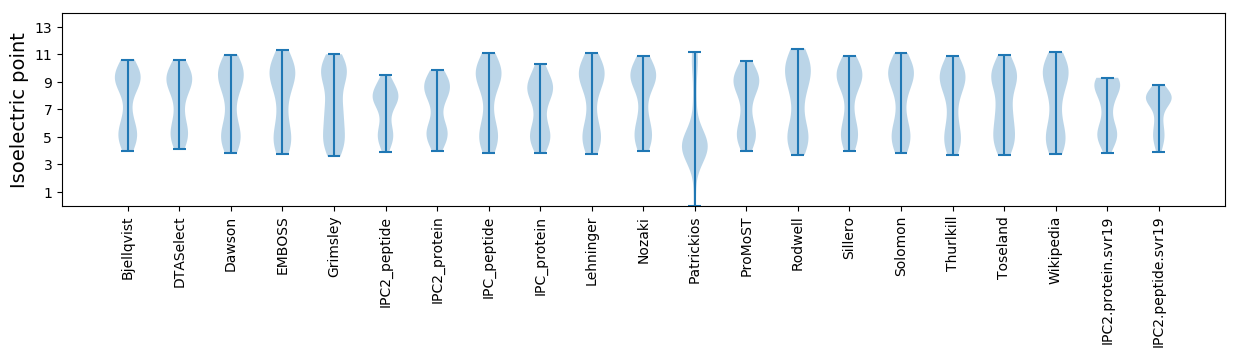
* You can choose from 21 different methods for calculating isoelectric point
Summary statistics related to proteome-wise predictions
Protein with the lowest isoelectric point:
>tr|A0A5Q2F3W1|A0A5Q2F3W1_9CAUD Uncharacterized protein OS=Citrobacter virus HCF1 OX=2653507 GN=HCF1_21 PE=4 SV=1
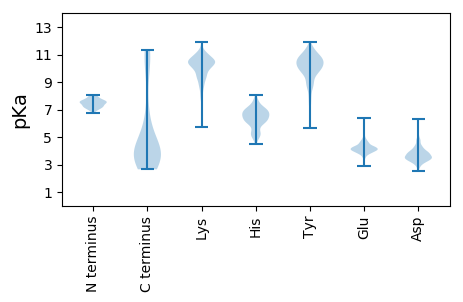
MM1 pKa = 7.63KK2 pKa = 10.37LLCTGEE8 pKa = 4.37YY9 pKa = 10.12PGFTHH14 pKa = 7.59GEE16 pKa = 4.28MYY18 pKa = 9.22TATVGFDD25 pKa = 2.82QTFGYY30 pKa = 9.44KK31 pKa = 10.13CYY33 pKa = 10.44VVKK36 pKa = 10.83DD37 pKa = 3.78DD38 pKa = 5.68DD39 pKa = 4.72GDD41 pKa = 3.76SRR43 pKa = 11.84SIDD46 pKa = 3.61FEE48 pKa = 4.33TEE50 pKa = 3.75DD51 pKa = 4.76FIEE54 pKa = 4.85DD55 pKa = 3.49KK56 pKa = 11.25YY57 pKa = 11.72LL58 pKa = 4.14
MM1 pKa = 7.63KK2 pKa = 10.37LLCTGEE8 pKa = 4.37YY9 pKa = 10.12PGFTHH14 pKa = 7.59GEE16 pKa = 4.28MYY18 pKa = 9.22TATVGFDD25 pKa = 2.82QTFGYY30 pKa = 9.44KK31 pKa = 10.13CYY33 pKa = 10.44VVKK36 pKa = 10.83DD37 pKa = 3.78DD38 pKa = 5.68DD39 pKa = 4.72GDD41 pKa = 3.76SRR43 pKa = 11.84SIDD46 pKa = 3.61FEE48 pKa = 4.33TEE50 pKa = 3.75DD51 pKa = 4.76FIEE54 pKa = 4.85DD55 pKa = 3.49KK56 pKa = 11.25YY57 pKa = 11.72LL58 pKa = 4.14
Molecular weight: 6.69 kDa
Isoelectric point according different methods:
Protein with the highest isoelectric point:
>tr|A0A5Q2F2M3|A0A5Q2F2M3_9CAUD Uncharacterized protein OS=Citrobacter virus HCF1 OX=2653507 GN=HCF1_03 PE=4 SV=1
MM1 pKa = 7.5IKK3 pKa = 10.15FRR5 pKa = 11.84YY6 pKa = 9.13LICTATRR13 pKa = 11.84TEE15 pKa = 4.01VARR18 pKa = 11.84ALTGLGEE25 pKa = 4.48HH26 pKa = 5.79GHH28 pKa = 6.04IVTVVKK34 pKa = 10.4RR35 pKa = 11.84KK36 pKa = 9.94SGAHH40 pKa = 5.3GSVKK44 pKa = 9.9IGMKK48 pKa = 8.34TQSHH52 pKa = 5.52SS53 pKa = 3.21
MM1 pKa = 7.5IKK3 pKa = 10.15FRR5 pKa = 11.84YY6 pKa = 9.13LICTATRR13 pKa = 11.84TEE15 pKa = 4.01VARR18 pKa = 11.84ALTGLGEE25 pKa = 4.48HH26 pKa = 5.79GHH28 pKa = 6.04IVTVVKK34 pKa = 10.4RR35 pKa = 11.84KK36 pKa = 9.94SGAHH40 pKa = 5.3GSVKK44 pKa = 9.9IGMKK48 pKa = 8.34TQSHH52 pKa = 5.52SS53 pKa = 3.21
Molecular weight: 5.76 kDa
Isoelectric point according different methods:
Peptides (in silico digests for buttom-up proteomics)
Below you can find in silico digests of the whole proteome with Trypsin, Chymotrypsin, Trypsin+LysC, LysN, ArgC proteases suitable for different mass spec machines.| Try ESI |
 |
|---|
| ChTry ESI |
|
|---|
| ArgC ESI |
|
|---|
| LysN ESI |
|
|---|
| TryLysC ESI |
|
|---|
| Try MALDI |
|
|---|
| ChTry MALDI |
|
|---|
| ArgC MALDI |
|
|---|
| LysN MALDI |
|
|---|
| TryLysC MALDI |
|
|---|
| Try LTQ |
|
|---|
| ChTry LTQ |
|
|---|
| ArgC LTQ |
|
|---|
| LysN LTQ |
|
|---|
| TryLysC LTQ |
|
|---|
| Try MSlow |
|
|---|
| ChTry MSlow |
|
|---|
| ArgC MSlow |
|
|---|
| LysN MSlow |
|
|---|
| TryLysC MSlow |
|
|---|
| Try MShigh |
|
|---|
| ChTry MShigh |
|
|---|
| ArgC MShigh |
|
|---|
| LysN MShigh |
|
|---|
| TryLysC MShigh |
|
|---|
General Statistics
Number of major isoforms |
Number of additional isoforms |
Number of all proteins |
Number of amino acids |
Min. Seq. Length |
Max. Seq. Length |
Avg. Seq. Length |
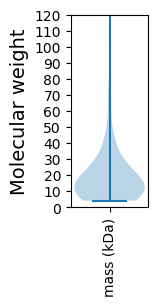
Avg. Mol. Weight |
|---|---|---|---|---|---|---|---|
0 |
12947 |
37 |
1238 |
182.4 |
20.57 |
Amino acid frequency
Ala |
Cys |
Asp |
Glu |
Phe |
Gly |
His |
Ile |
Lys |
Leu |
|---|---|---|---|---|---|---|---|---|---|
7.732 ± 0.352 | 1.699 ± 0.201 |
5.886 ± 0.248 | 6.372 ± 0.288 |
4.117 ± 0.187 | 6.928 ± 0.299 |
1.854 ± 0.227 | 6.534 ± 0.262 |
7.222 ± 0.353 | 7.229 ± 0.259 |
Met |
Asn |
Gln |
Pro |
Arg |
Ser |
Thr |
Val |
Trp |
Tyr |
|---|---|---|---|---|---|---|---|---|---|
2.958 ± 0.197 | 4.596 ± 0.215 |
3.136 ± 0.221 | 3.684 ± 0.269 |
6.001 ± 0.294 | 6.249 ± 0.285 |
5.77 ± 0.288 | 6.89 ± 0.262 |
1.444 ± 0.103 | 3.7 ± 0.188 |
Most of the basic statistics you can see at this page can be downloaded from this CSV file
See this proteome in:

Proteome-pI is available under Creative Commons Attribution-NoDerivs license, for more details see here
| Reference: Kozlowski LP. Proteome-pI 2.0: Proteome Isoelectric Point Database Update. Nucleic Acids Res. 2021, doi: 10.1093/nar/gkab944 | Contact: Lukasz P. Kozlowski |