Gordonia phage PhorbesPhlower
Taxonomy: Viruses; Duplodnaviria; Heunggongvirae; Uroviricota; Caudoviricetes; Caudovirales; Siphoviridae; Luckytenvirus; unclassified Luckytenvirus
Average proteome isoelectric point is 6.26
Get precalculated fractions of proteins
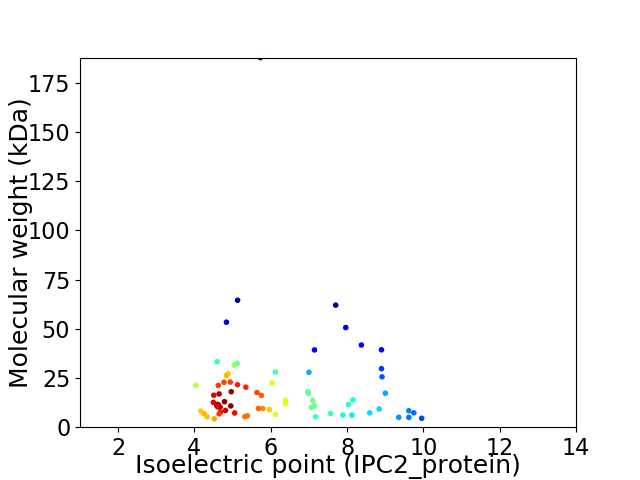
Virtual 2D-PAGE plot for 72 proteins (isoelectric point calculated using IPC2_protein)
Get csv file with sequences according to given criteria:
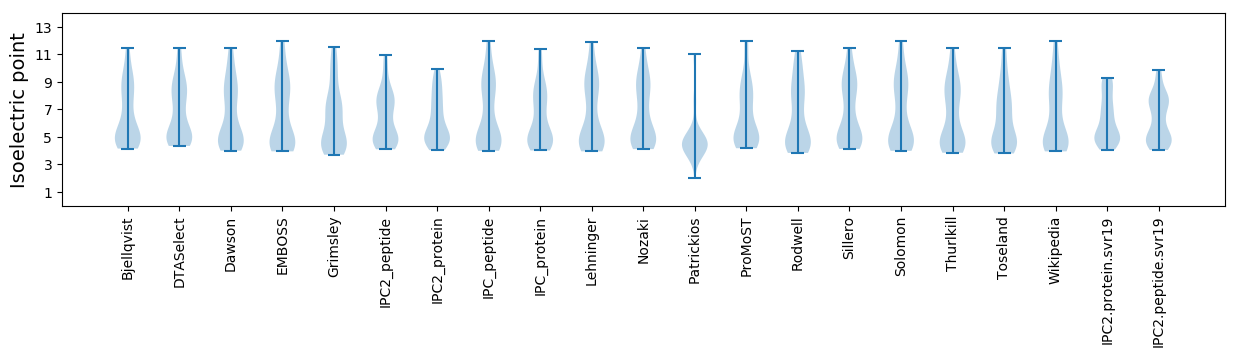
* You can choose from 21 different methods for calculating isoelectric point
Summary statistics related to proteome-wise predictions
Protein with the lowest isoelectric point:
>tr|A0A516KPS1|A0A516KPS1_9CAUD DUF1508 domain-containing protein OS=Gordonia phage PhorbesPhlower OX=2596973 GN=51 PE=4 SV=1
MM1 pKa = 7.41GVFEE5 pKa = 4.15QVSLVVGGEE14 pKa = 4.13HH15 pKa = 6.69WGSMAPSAAVDD26 pKa = 3.83LAITAYY32 pKa = 10.36AAAQHH37 pKa = 6.84AGDD40 pKa = 3.94TQQ42 pKa = 3.21
MM1 pKa = 7.41GVFEE5 pKa = 4.15QVSLVVGGEE14 pKa = 4.13HH15 pKa = 6.69WGSMAPSAAVDD26 pKa = 3.83LAITAYY32 pKa = 10.36AAAQHH37 pKa = 6.84AGDD40 pKa = 3.94TQQ42 pKa = 3.21
Molecular weight: 4.24 kDa
Isoelectric point according different methods:
Protein with the highest isoelectric point:
>tr|A0A516KPS7|A0A516KPS7_9CAUD Uncharacterized protein OS=Gordonia phage PhorbesPhlower OX=2596973 GN=50 PE=4 SV=1
MM1 pKa = 7.6TDD3 pKa = 3.19DD4 pKa = 4.5DD5 pKa = 6.0RR6 pKa = 11.84RR7 pKa = 11.84MLDD10 pKa = 3.72LAGQRR15 pKa = 11.84WKK17 pKa = 11.06YY18 pKa = 10.66AGSLEE23 pKa = 4.01QRR25 pKa = 11.84VRR27 pKa = 11.84DD28 pKa = 3.59EE29 pKa = 4.59FGISLTRR36 pKa = 11.84FWQKK40 pKa = 10.39VGQLIDD46 pKa = 3.62TEE48 pKa = 4.28EE49 pKa = 4.33ALAYY53 pKa = 10.43APIVVNRR60 pKa = 11.84LRR62 pKa = 11.84RR63 pKa = 11.84LRR65 pKa = 11.84TARR68 pKa = 11.84RR69 pKa = 11.84RR70 pKa = 3.54
MM1 pKa = 7.6TDD3 pKa = 3.19DD4 pKa = 4.5DD5 pKa = 6.0RR6 pKa = 11.84RR7 pKa = 11.84MLDD10 pKa = 3.72LAGQRR15 pKa = 11.84WKK17 pKa = 11.06YY18 pKa = 10.66AGSLEE23 pKa = 4.01QRR25 pKa = 11.84VRR27 pKa = 11.84DD28 pKa = 3.59EE29 pKa = 4.59FGISLTRR36 pKa = 11.84FWQKK40 pKa = 10.39VGQLIDD46 pKa = 3.62TEE48 pKa = 4.28EE49 pKa = 4.33ALAYY53 pKa = 10.43APIVVNRR60 pKa = 11.84LRR62 pKa = 11.84RR63 pKa = 11.84LRR65 pKa = 11.84TARR68 pKa = 11.84RR69 pKa = 11.84RR70 pKa = 3.54
Molecular weight: 8.37 kDa
Isoelectric point according different methods:
Peptides (in silico digests for buttom-up proteomics)
Below you can find in silico digests of the whole proteome with Trypsin, Chymotrypsin, Trypsin+LysC, LysN, ArgC proteases suitable for different mass spec machines.| Try ESI |
 |
|---|
| ChTry ESI |
|
|---|
| ArgC ESI |
|
|---|
| LysN ESI |
|
|---|
| TryLysC ESI |
|
|---|
| Try MALDI |
|
|---|
| ChTry MALDI |
|
|---|
| ArgC MALDI |
|
|---|
| LysN MALDI |
|
|---|
| TryLysC MALDI |
|
|---|
| Try LTQ |
|
|---|
| ChTry LTQ |
|
|---|
| ArgC LTQ |
|
|---|
| LysN LTQ |
|
|---|
| TryLysC LTQ |
|
|---|
| Try MSlow |
|
|---|
| ChTry MSlow |
|
|---|
| ArgC MSlow |
|
|---|
| LysN MSlow |
|
|---|
| TryLysC MSlow |
|
|---|
| Try MShigh |
|
|---|
| ChTry MShigh |
|
|---|
| ArgC MShigh |
|
|---|
| LysN MShigh |
|
|---|
| TryLysC MShigh |
|
|---|
General Statistics
Number of major isoforms |
Number of additional isoforms |
Number of all proteins |
Number of amino acids |
Min. Seq. Length |
Max. Seq. Length |
Avg. Seq. Length |
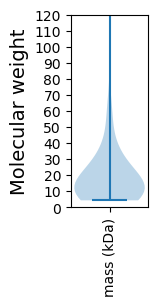
Avg. Mol. Weight |
|---|---|---|---|---|---|---|---|
0 |
13191 |
37 |
1797 |
183.2 |
19.99 |
Amino acid frequency
Ala |
Cys |
Asp |
Glu |
Phe |
Gly |
His |
Ile |
Lys |
Leu |
|---|---|---|---|---|---|---|---|---|---|
11.675 ± 0.56 | 0.841 ± 0.173 |
6.641 ± 0.256 | 6.08 ± 0.343 |
2.449 ± 0.142 | 8.491 ± 0.569 |
1.986 ± 0.212 | 4.859 ± 0.248 |
3.631 ± 0.227 | 7.831 ± 0.241 |
Met |
Asn |
Gln |
Pro |
Arg |
Ser |
Thr |
Val |
Trp |
Tyr |
|---|---|---|---|---|---|---|---|---|---|
2.388 ± 0.16 | 3.108 ± 0.224 |
5.542 ± 0.308 | 3.442 ± 0.253 |
7.513 ± 0.438 | 5.648 ± 0.242 |
6.694 ± 0.325 | 6.959 ± 0.283 |
2.107 ± 0.15 | 2.115 ± 0.127 |
Most of the basic statistics you can see at this page can be downloaded from this CSV file
See this proteome in:

Proteome-pI is available under Creative Commons Attribution-NoDerivs license, for more details see here
| Reference: Kozlowski LP. Proteome-pI 2.0: Proteome Isoelectric Point Database Update. Nucleic Acids Res. 2021, doi: 10.1093/nar/gkab944 | Contact: Lukasz P. Kozlowski |