Ferriphaselus amnicola
Taxonomy: cellular organisms; Bacteria; Proteobacteria; Betaproteobacteria; Nitrosomonadales; Gallionellaceae; Ferriphaselus
Average proteome isoelectric point is 6.48
Get precalculated fractions of proteins
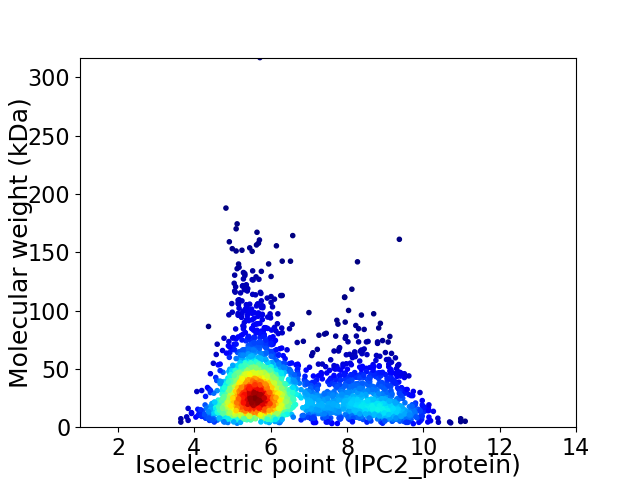
Virtual 2D-PAGE plot for 2668 proteins (isoelectric point calculated using IPC2_protein)
Get csv file with sequences according to given criteria:
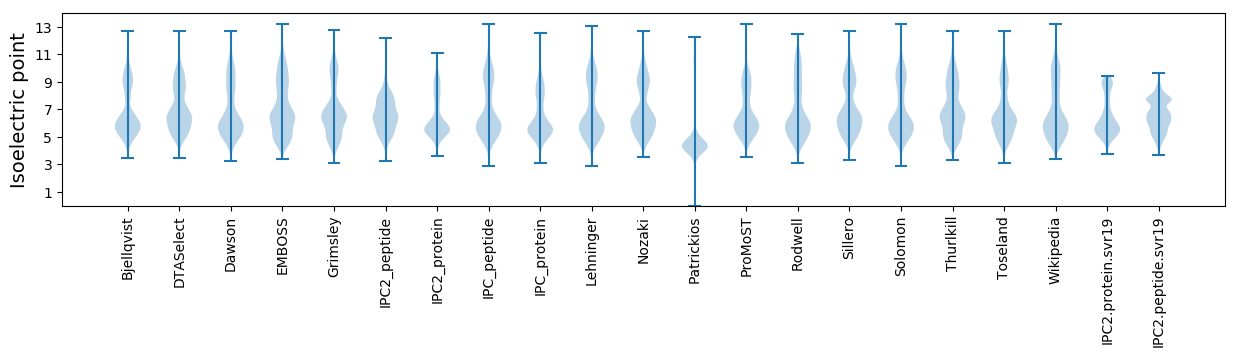
* You can choose from 21 different methods for calculating isoelectric point
Summary statistics related to proteome-wise predictions
Protein with the lowest isoelectric point:
>tr|A0A2Z6GBS4|A0A2Z6GBS4_9PROT Uncharacterized protein OS=Ferriphaselus amnicola OX=1188319 GN=OYT1_ch1391 PE=4 SV=1
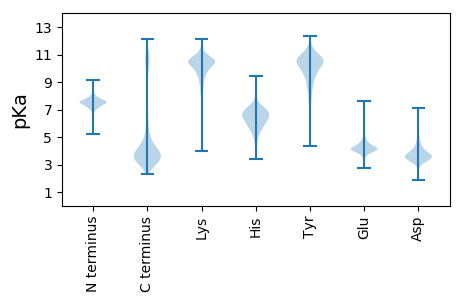
MM1 pKa = 7.63GDD3 pKa = 3.33MVFAAHH9 pKa = 7.3DD10 pKa = 4.41LYY12 pKa = 11.49NEE14 pKa = 4.17SLEE17 pKa = 4.29EE18 pKa = 4.09TGEE21 pKa = 4.03SSIPGVEE28 pKa = 3.91PDD30 pKa = 4.36ALLAAAGTRR39 pKa = 11.84GVVVNVGHH47 pKa = 6.01AQEE50 pKa = 4.51MPNEE54 pKa = 4.26EE55 pKa = 4.09IYY57 pKa = 10.84LVRR60 pKa = 11.84FEE62 pKa = 4.67IDD64 pKa = 2.83ADD66 pKa = 3.85GTLAEE71 pKa = 5.37PIGCLSDD78 pKa = 3.58EE79 pKa = 4.58LSGLNN84 pKa = 3.86
MM1 pKa = 7.63GDD3 pKa = 3.33MVFAAHH9 pKa = 7.3DD10 pKa = 4.41LYY12 pKa = 11.49NEE14 pKa = 4.17SLEE17 pKa = 4.29EE18 pKa = 4.09TGEE21 pKa = 4.03SSIPGVEE28 pKa = 3.91PDD30 pKa = 4.36ALLAAAGTRR39 pKa = 11.84GVVVNVGHH47 pKa = 6.01AQEE50 pKa = 4.51MPNEE54 pKa = 4.26EE55 pKa = 4.09IYY57 pKa = 10.84LVRR60 pKa = 11.84FEE62 pKa = 4.67IDD64 pKa = 2.83ADD66 pKa = 3.85GTLAEE71 pKa = 5.37PIGCLSDD78 pKa = 3.58EE79 pKa = 4.58LSGLNN84 pKa = 3.86
Molecular weight: 8.86 kDa
Isoelectric point according different methods:
Protein with the highest isoelectric point:
>tr|A0A2Z6GBY6|A0A2Z6GBY6_9PROT Polysaccharide export protein OS=Ferriphaselus amnicola OX=1188319 GN=OYT1_ch1464 PE=4 SV=1
MM1 pKa = 7.35KK2 pKa = 10.08RR3 pKa = 11.84ISQAGFLKK11 pKa = 10.34PFRR14 pKa = 11.84RR15 pKa = 11.84FLRR18 pKa = 11.84TILQSRR24 pKa = 11.84FVRR27 pKa = 11.84TGNKK31 pKa = 9.72KK32 pKa = 10.1PGLVKK37 pKa = 10.89ANAGLL42 pKa = 3.57
MM1 pKa = 7.35KK2 pKa = 10.08RR3 pKa = 11.84ISQAGFLKK11 pKa = 10.34PFRR14 pKa = 11.84RR15 pKa = 11.84FLRR18 pKa = 11.84TILQSRR24 pKa = 11.84FVRR27 pKa = 11.84TGNKK31 pKa = 9.72KK32 pKa = 10.1PGLVKK37 pKa = 10.89ANAGLL42 pKa = 3.57
Molecular weight: 4.8 kDa
Isoelectric point according different methods:
Peptides (in silico digests for buttom-up proteomics)
Below you can find in silico digests of the whole proteome with Trypsin, Chymotrypsin, Trypsin+LysC, LysN, ArgC proteases suitable for different mass spec machines.| Try ESI |
 |
|---|
| ChTry ESI |
|
|---|
| ArgC ESI |
|
|---|
| LysN ESI |
|
|---|
| TryLysC ESI |
|
|---|
| Try MALDI |
|
|---|
| ChTry MALDI |
|
|---|
| ArgC MALDI |
|
|---|
| LysN MALDI |
|
|---|
| TryLysC MALDI |
|
|---|
| Try LTQ |
|
|---|
| ChTry LTQ |
|
|---|
| ArgC LTQ |
|
|---|
| LysN LTQ |
|
|---|
| TryLysC LTQ |
|
|---|
| Try MSlow |
|
|---|
| ChTry MSlow |
|
|---|
| ArgC MSlow |
|
|---|
| LysN MSlow |
|
|---|
| TryLysC MSlow |
|
|---|
| Try MShigh |
|
|---|
| ChTry MShigh |
|
|---|
| ArgC MShigh |
|
|---|
| LysN MShigh |
|
|---|
| TryLysC MShigh |
|
|---|
General Statistics
Number of major isoforms |
Number of additional isoforms |
Number of all proteins |
Number of amino acids |
Min. Seq. Length |
Max. Seq. Length |
Avg. Seq. Length |
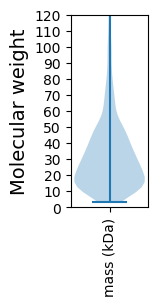
Avg. Mol. Weight |
|---|---|---|---|---|---|---|---|
0 |
828448 |
30 |
2834 |
310.5 |
34.16 |
Amino acid frequency
Ala |
Cys |
Asp |
Glu |
Phe |
Gly |
His |
Ile |
Lys |
Leu |
|---|---|---|---|---|---|---|---|---|---|
10.744 ± 0.053 | 0.966 ± 0.016 |
5.24 ± 0.03 | 6.017 ± 0.048 |
3.681 ± 0.032 | 7.459 ± 0.05 |
2.417 ± 0.022 | 5.366 ± 0.037 |
4.258 ± 0.046 | 10.923 ± 0.064 |
Met |
Asn |
Gln |
Pro |
Arg |
Ser |
Thr |
Val |
Trp |
Tyr |
|---|---|---|---|---|---|---|---|---|---|
2.625 ± 0.026 | 3.29 ± 0.031 |
4.363 ± 0.035 | 4.259 ± 0.034 |
5.998 ± 0.045 | 6.007 ± 0.037 |
5.158 ± 0.041 | 7.338 ± 0.048 |
1.296 ± 0.019 | 2.595 ± 0.027 |
Most of the basic statistics you can see at this page can be downloaded from this CSV file
See this proteome in:

Proteome-pI is available under Creative Commons Attribution-NoDerivs license, for more details see here
| Reference: Kozlowski LP. Proteome-pI 2.0: Proteome Isoelectric Point Database Update. Nucleic Acids Res. 2021, doi: 10.1093/nar/gkab944 | Contact: Lukasz P. Kozlowski |