Clostridium butyricum E4 str. BoNT E BL5262
Taxonomy: cellular organisms; Bacteria; Terrabacteria group; Firmicutes; Clostridia; Eubacteriales; Clostridiaceae; Clostridium; Clostridium butyricum
Average proteome isoelectric point is 6.25
Get precalculated fractions of proteins
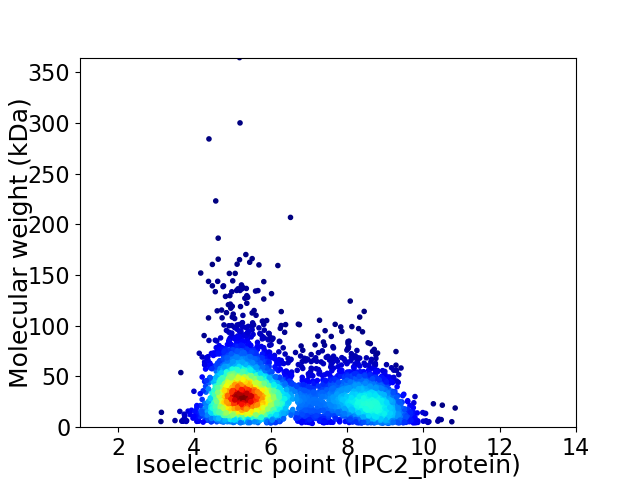
Virtual 2D-PAGE plot for 4245 proteins (isoelectric point calculated using IPC2_protein)
Get csv file with sequences according to given criteria:
* You can choose from 21 different methods for calculating isoelectric point
Summary statistics related to proteome-wise predictions
Protein with the lowest isoelectric point:
>tr|C4IMN1|C4IMN1_CLOBU Stage II sporulation protein E OS=Clostridium butyricum E4 str. BoNT E BL5262 OX=632245 GN=spoIIE PE=4 SV=1
MM1 pKa = 7.58KK2 pKa = 9.74ATVDD6 pKa = 3.46KK7 pKa = 9.21DD8 pKa = 3.51TCIACGLCPSICPEE22 pKa = 3.97CFEE25 pKa = 5.78IEE27 pKa = 4.27DD28 pKa = 4.06DD29 pKa = 4.07GKK31 pKa = 11.07AGFIVDD37 pKa = 4.15EE38 pKa = 4.8APSGSEE44 pKa = 4.55DD45 pKa = 3.69EE46 pKa = 4.5VKK48 pKa = 10.45EE49 pKa = 3.97AAEE52 pKa = 4.22SCPVSAISVDD62 pKa = 3.32
MM1 pKa = 7.58KK2 pKa = 9.74ATVDD6 pKa = 3.46KK7 pKa = 9.21DD8 pKa = 3.51TCIACGLCPSICPEE22 pKa = 3.97CFEE25 pKa = 5.78IEE27 pKa = 4.27DD28 pKa = 4.06DD29 pKa = 4.07GKK31 pKa = 11.07AGFIVDD37 pKa = 4.15EE38 pKa = 4.8APSGSEE44 pKa = 4.55DD45 pKa = 3.69EE46 pKa = 4.5VKK48 pKa = 10.45EE49 pKa = 3.97AAEE52 pKa = 4.22SCPVSAISVDD62 pKa = 3.32
Molecular weight: 6.43 kDa
Isoelectric point according different methods:
Protein with the highest isoelectric point:
>tr|C4IHI9|C4IHI9_CLOBU Uncharacterized protein OS=Clostridium butyricum E4 str. BoNT E BL5262 OX=632245 GN=CLP_2720 PE=4 SV=1
MM1 pKa = 7.43NPLLNMILGSLFPGMGGMMNNPMGGMGNMGGNPLMSMLMGGLGGGMNPMMGGGMNPMMGNPMNQLTQMMGGQSNNMPNMNNMPNMNNMNMGNMNPLISMLMGGQSNNGQMAPNNMNTQTPGNNQAPMMNNNMNMGNLNPLMSMLMGNRR149 pKa = 11.84NMGMNNTPMRR159 pKa = 11.84NNRR162 pKa = 11.84MMNNNQNIPQRR173 pKa = 11.84KK174 pKa = 7.52RR175 pKa = 3.06
MM1 pKa = 7.43NPLLNMILGSLFPGMGGMMNNPMGGMGNMGGNPLMSMLMGGLGGGMNPMMGGGMNPMMGNPMNQLTQMMGGQSNNMPNMNNMPNMNNMNMGNMNPLISMLMGGQSNNGQMAPNNMNTQTPGNNQAPMMNNNMNMGNLNPLMSMLMGNRR149 pKa = 11.84NMGMNNTPMRR159 pKa = 11.84NNRR162 pKa = 11.84MMNNNQNIPQRR173 pKa = 11.84KK174 pKa = 7.52RR175 pKa = 3.06
Molecular weight: 18.92 kDa
Isoelectric point according different methods:
Peptides (in silico digests for buttom-up proteomics)
Below you can find in silico digests of the whole proteome with Trypsin, Chymotrypsin, Trypsin+LysC, LysN, ArgC proteases suitable for different mass spec machines.| Try ESI |
 |
|---|
| ChTry ESI |
|
|---|
| ArgC ESI |
|
|---|
| LysN ESI |
|
|---|
| TryLysC ESI |
|
|---|
| Try MALDI |
|
|---|
| ChTry MALDI |
|
|---|
| ArgC MALDI |
|
|---|
| LysN MALDI |
|
|---|
| TryLysC MALDI |
|
|---|
| Try LTQ |
|
|---|
| ChTry LTQ |
|
|---|
| ArgC LTQ |
|
|---|
| LysN LTQ |
|
|---|
| TryLysC LTQ |
|
|---|
| Try MSlow |
|
|---|
| ChTry MSlow |
|
|---|
| ArgC MSlow |
|
|---|
| LysN MSlow |
|
|---|
| TryLysC MSlow |
|
|---|
| Try MShigh |
|
|---|
| ChTry MShigh |
|
|---|
| ArgC MShigh |
|
|---|
| LysN MShigh |
|
|---|
| TryLysC MShigh |
|
|---|
General Statistics
Number of major isoforms |
Number of additional isoforms |
Number of all proteins |
Number of amino acids |
Min. Seq. Length |
Max. Seq. Length |
Avg. Seq. Length |
Avg. Mol. Weight |
|---|---|---|---|---|---|---|---|
0 |
1321973 |
33 |
3156 |
311.4 |
35.19 |
Amino acid frequency
Ala |
Cys |
Asp |
Glu |
Phe |
Gly |
His |
Ile |
Lys |
Leu |
|---|---|---|---|---|---|---|---|---|---|
5.415 ± 0.044 | 1.347 ± 0.017 |
5.841 ± 0.029 | 7.473 ± 0.043 |
4.334 ± 0.026 | 6.345 ± 0.037 |
1.325 ± 0.015 | 9.99 ± 0.049 |
8.924 ± 0.035 | 8.642 ± 0.034 |
Met |
Asn |
Gln |
Pro |
Arg |
Ser |
Thr |
Val |
Trp |
Tyr |
|---|---|---|---|---|---|---|---|---|---|
2.685 ± 0.018 | 6.738 ± 0.041 |
2.602 ± 0.02 | 2.284 ± 0.019 |
3.147 ± 0.025 | 6.596 ± 0.034 |
4.956 ± 0.032 | 6.321 ± 0.029 |
0.726 ± 0.012 | 4.311 ± 0.032 |
Most of the basic statistics you can see at this page can be downloaded from this CSV file
See this proteome in:

Proteome-pI is available under Creative Commons Attribution-NoDerivs license, for more details see here
| Reference: Kozlowski LP. Proteome-pI 2.0: Proteome Isoelectric Point Database Update. Nucleic Acids Res. 2021, doi: 10.1093/nar/gkab944 | Contact: Lukasz P. Kozlowski |