Hibiscus syriacus (Rose of Sharon)
Taxonomy: cellular organisms; Eukaryota; Viridiplantae; Streptophyta; Streptophytina; Embryophyta; Tracheophyta; Euphyllophyta; Spermatophyta; Magnoliopsida; Mesangiospermae; eudicotyledons; Gunneridae; Pentapetalae; rosids; malvids; Malvales; Malvaceae; Malvoideae; Hibiscus
Average proteome isoelectric point is 6.76
Get precalculated fractions of proteins
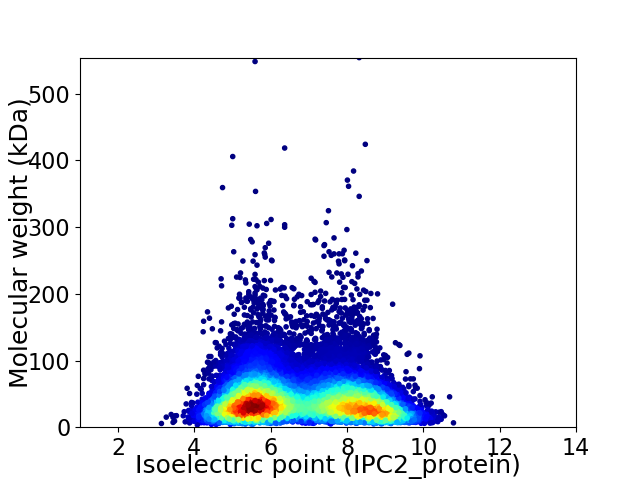
Virtual 2D-PAGE plot for 82460 proteins (isoelectric point calculated using IPC2_protein)
Get csv file with sequences according to given criteria:
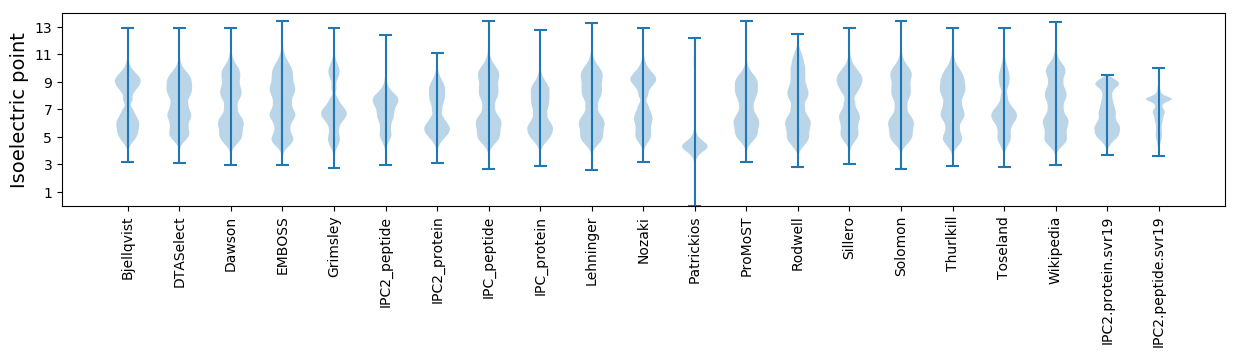
* You can choose from 21 different methods for calculating isoelectric point
Summary statistics related to proteome-wise predictions
Protein with the lowest isoelectric point:
>tr|A0A6A2X3B2|A0A6A2X3B2_HIBSY Patatin OS=Hibiscus syriacus OX=106335 GN=F3Y22_tig00117002pilonHSYRG00052 PE=3 SV=1
MM1 pKa = 6.87EE2 pKa = 5.97TITASFRR9 pKa = 11.84KK10 pKa = 9.58ISLNHH15 pKa = 6.15KK16 pKa = 9.73GGPEE20 pKa = 4.04EE21 pKa = 4.2EE22 pKa = 5.42DD23 pKa = 3.59GDD25 pKa = 3.99NKK27 pKa = 10.38IPNGAVSEE35 pKa = 4.37LSSHH39 pKa = 6.34VSLPYY44 pKa = 10.27YY45 pKa = 10.66LKK47 pKa = 10.23QQCLDD52 pKa = 3.69LKK54 pKa = 10.85AAEE57 pKa = 4.22IQCKK61 pKa = 7.9NRR63 pKa = 11.84RR64 pKa = 11.84DD65 pKa = 3.97GVEE68 pKa = 3.8PADD71 pKa = 4.73DD72 pKa = 3.75PRR74 pKa = 11.84AEE76 pKa = 4.12YY77 pKa = 10.81GGDD80 pKa = 3.59YY81 pKa = 11.08SPDD84 pKa = 3.26GDD86 pKa = 5.73DD87 pKa = 5.78YY88 pKa = 11.69IDD90 pKa = 5.71DD91 pKa = 5.48DD92 pKa = 6.52DD93 pKa = 6.51YY94 pKa = 12.07DD95 pKa = 5.62DD96 pKa = 6.0DD97 pKa = 3.85GWYY100 pKa = 10.29DD101 pKa = 3.65SDD103 pKa = 4.37SDD105 pKa = 4.65DD106 pKa = 3.71YY107 pKa = 11.89SSSEE111 pKa = 4.54DD112 pKa = 4.13CDD114 pKa = 5.11DD115 pKa = 6.23DD116 pKa = 6.1EE117 pKa = 8.23DD118 pKa = 6.68DD119 pKa = 6.38GDD121 pKa = 6.14DD122 pKa = 5.2DD123 pKa = 6.78DD124 pKa = 6.51DD125 pKa = 4.07DD126 pKa = 4.69HH127 pKa = 9.53RR128 pKa = 11.84EE129 pKa = 3.87EE130 pKa = 4.96PEE132 pKa = 3.81EE133 pKa = 3.98EE134 pKa = 4.42EE135 pKa = 4.34YY136 pKa = 11.15DD137 pKa = 3.74VLVAGGCSRR146 pKa = 11.84CYY148 pKa = 10.1MYY150 pKa = 10.96FLVPKK155 pKa = 9.86KK156 pKa = 11.03SNGCPRR162 pKa = 11.84CNGPLIRR169 pKa = 11.84FDD171 pKa = 3.68NGEE174 pKa = 3.9PEE176 pKa = 4.25YY177 pKa = 10.54PP178 pKa = 3.58
MM1 pKa = 6.87EE2 pKa = 5.97TITASFRR9 pKa = 11.84KK10 pKa = 9.58ISLNHH15 pKa = 6.15KK16 pKa = 9.73GGPEE20 pKa = 4.04EE21 pKa = 4.2EE22 pKa = 5.42DD23 pKa = 3.59GDD25 pKa = 3.99NKK27 pKa = 10.38IPNGAVSEE35 pKa = 4.37LSSHH39 pKa = 6.34VSLPYY44 pKa = 10.27YY45 pKa = 10.66LKK47 pKa = 10.23QQCLDD52 pKa = 3.69LKK54 pKa = 10.85AAEE57 pKa = 4.22IQCKK61 pKa = 7.9NRR63 pKa = 11.84RR64 pKa = 11.84DD65 pKa = 3.97GVEE68 pKa = 3.8PADD71 pKa = 4.73DD72 pKa = 3.75PRR74 pKa = 11.84AEE76 pKa = 4.12YY77 pKa = 10.81GGDD80 pKa = 3.59YY81 pKa = 11.08SPDD84 pKa = 3.26GDD86 pKa = 5.73DD87 pKa = 5.78YY88 pKa = 11.69IDD90 pKa = 5.71DD91 pKa = 5.48DD92 pKa = 6.52DD93 pKa = 6.51YY94 pKa = 12.07DD95 pKa = 5.62DD96 pKa = 6.0DD97 pKa = 3.85GWYY100 pKa = 10.29DD101 pKa = 3.65SDD103 pKa = 4.37SDD105 pKa = 4.65DD106 pKa = 3.71YY107 pKa = 11.89SSSEE111 pKa = 4.54DD112 pKa = 4.13CDD114 pKa = 5.11DD115 pKa = 6.23DD116 pKa = 6.1EE117 pKa = 8.23DD118 pKa = 6.68DD119 pKa = 6.38GDD121 pKa = 6.14DD122 pKa = 5.2DD123 pKa = 6.78DD124 pKa = 6.51DD125 pKa = 4.07DD126 pKa = 4.69HH127 pKa = 9.53RR128 pKa = 11.84EE129 pKa = 3.87EE130 pKa = 4.96PEE132 pKa = 3.81EE133 pKa = 3.98EE134 pKa = 4.42EE135 pKa = 4.34YY136 pKa = 11.15DD137 pKa = 3.74VLVAGGCSRR146 pKa = 11.84CYY148 pKa = 10.1MYY150 pKa = 10.96FLVPKK155 pKa = 9.86KK156 pKa = 11.03SNGCPRR162 pKa = 11.84CNGPLIRR169 pKa = 11.84FDD171 pKa = 3.68NGEE174 pKa = 3.9PEE176 pKa = 4.25YY177 pKa = 10.54PP178 pKa = 3.58
Molecular weight: 20.04 kDa
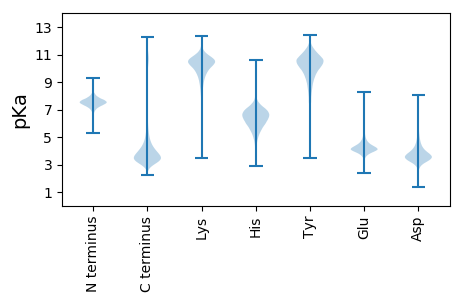
Isoelectric point according different methods:
Protein with the highest isoelectric point:
>tr|A0A6A2ZPC3|A0A6A2ZPC3_HIBSY DnaJ protein ERDJ3B OS=Hibiscus syriacus OX=106335 GN=F3Y22_tig00110794pilonHSYRG00131 PE=4 SV=1
MM1 pKa = 7.14VVTHH5 pKa = 6.09HH6 pKa = 6.58RR7 pKa = 11.84ARR9 pKa = 11.84RR10 pKa = 11.84GVMTRR15 pKa = 11.84RR16 pKa = 11.84FWRR19 pKa = 11.84LRR21 pKa = 11.84WGGVALTAAWQQLKK35 pKa = 9.66RR36 pKa = 11.84QRR38 pKa = 11.84GGGGG42 pKa = 2.97
MM1 pKa = 7.14VVTHH5 pKa = 6.09HH6 pKa = 6.58RR7 pKa = 11.84ARR9 pKa = 11.84RR10 pKa = 11.84GVMTRR15 pKa = 11.84RR16 pKa = 11.84FWRR19 pKa = 11.84LRR21 pKa = 11.84WGGVALTAAWQQLKK35 pKa = 9.66RR36 pKa = 11.84QRR38 pKa = 11.84GGGGG42 pKa = 2.97
Molecular weight: 4.9 kDa
Isoelectric point according different methods:
Peptides (in silico digests for buttom-up proteomics)
Below you can find in silico digests of the whole proteome with Trypsin, Chymotrypsin, Trypsin+LysC, LysN, ArgC proteases suitable for different mass spec machines.| Try ESI |
 |
|---|
| ChTry ESI |
|
|---|
| ArgC ESI |
|
|---|
| LysN ESI |
|
|---|
| TryLysC ESI |
|
|---|
| Try MALDI |
|
|---|
| ChTry MALDI |
|
|---|
| ArgC MALDI |
|
|---|
| LysN MALDI |
|
|---|
| TryLysC MALDI |
|
|---|
| Try LTQ |
|
|---|
| ChTry LTQ |
|
|---|
| ArgC LTQ |
|
|---|
| LysN LTQ |
|
|---|
| TryLysC LTQ |
|
|---|
| Try MSlow |
|
|---|
| ChTry MSlow |
|
|---|
| ArgC MSlow |
|
|---|
| LysN MSlow |
|
|---|
| TryLysC MSlow |
|
|---|
| Try MShigh |
|
|---|
| ChTry MShigh |
|
|---|
| ArgC MShigh |
|
|---|
| LysN MShigh |
|
|---|
| TryLysC MShigh |
|
|---|
General Statistics
Number of major isoforms |
Number of additional isoforms |
Number of all proteins |
Number of amino acids |
Min. Seq. Length |
Max. Seq. Length |
Avg. Seq. Length |
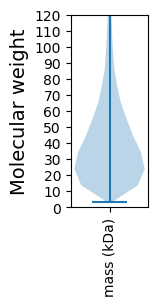
Avg. Mol. Weight |
|---|---|---|---|---|---|---|---|
0 |
32943284 |
30 |
8999 |
399.5 |
44.63 |
Amino acid frequency
Ala |
Cys |
Asp |
Glu |
Phe |
Gly |
His |
Ile |
Lys |
Leu |
|---|---|---|---|---|---|---|---|---|---|
6.598 ± 0.008 | 1.912 ± 0.004 |
5.321 ± 0.006 | 6.405 ± 0.008 |
4.242 ± 0.005 | 6.546 ± 0.007 |
2.396 ± 0.004 | 5.266 ± 0.006 |
6.181 ± 0.008 | 9.522 ± 0.01 |
Met |
Asn |
Gln |
Pro |
Arg |
Ser |
Thr |
Val |
Trp |
Tyr |
|---|---|---|---|---|---|---|---|---|---|
2.492 ± 0.003 | 4.556 ± 0.005 |
4.918 ± 0.008 | 3.651 ± 0.006 |
5.398 ± 0.006 | 8.99 ± 0.01 |
4.937 ± 0.005 | 6.557 ± 0.006 |
1.346 ± 0.003 | 2.767 ± 0.004 |
Most of the basic statistics you can see at this page can be downloaded from this CSV file
See this proteome in:

Proteome-pI is available under Creative Commons Attribution-NoDerivs license, for more details see here
| Reference: Kozlowski LP. Proteome-pI 2.0: Proteome Isoelectric Point Database Update. Nucleic Acids Res. 2021, doi: 10.1093/nar/gkab944 | Contact: Lukasz P. Kozlowski |