Tortoise microvirus 79
Taxonomy: Viruses; Monodnaviria; Sangervirae; Phixviricota; Malgrandaviricetes; Petitvirales; Microviridae; unclassified Microviridae
Average proteome isoelectric point is 7.25
Get precalculated fractions of proteins
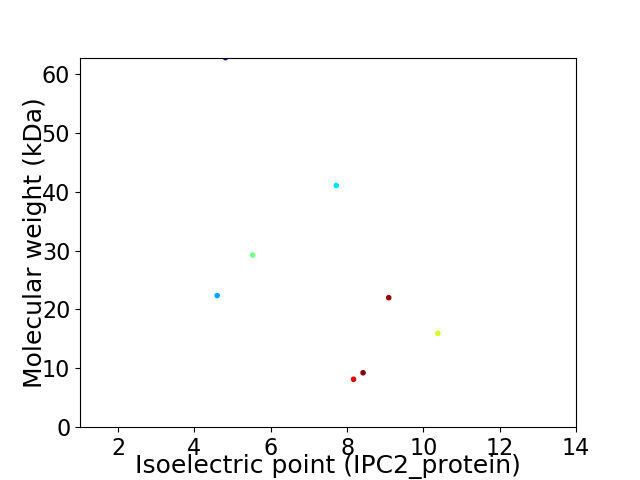
Virtual 2D-PAGE plot for 8 proteins (isoelectric point calculated using IPC2_protein)
Get csv file with sequences according to given criteria:
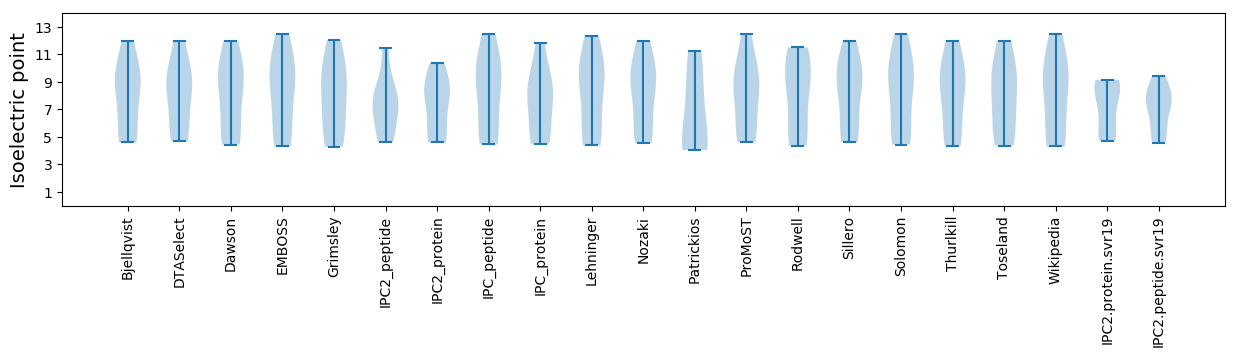
* You can choose from 21 different methods for calculating isoelectric point
Summary statistics related to proteome-wise predictions
Protein with the lowest isoelectric point:
>tr|A0A4P8WA22|A0A4P8WA22_9VIRU Peptidase_M15_4 domain-containing protein OS=Tortoise microvirus 79 OX=2583186 PE=4 SV=1
MM1 pKa = 7.45TIKK4 pKa = 10.81NLGEE8 pKa = 3.91VFAMRR13 pKa = 11.84RR14 pKa = 11.84LEE16 pKa = 4.3GGSLILPKK24 pKa = 9.07EE25 pKa = 4.1TRR27 pKa = 11.84RR28 pKa = 11.84KK29 pKa = 9.8VRR31 pKa = 11.84IEE33 pKa = 4.08FNVDD37 pKa = 2.93TPASVYY43 pKa = 10.81AIDD46 pKa = 4.85RR47 pKa = 11.84GQDD50 pKa = 3.38GPGDD54 pKa = 3.73LSSSRR59 pKa = 11.84FIADD63 pKa = 3.32LDD65 pKa = 3.91GFTVLEE71 pKa = 4.86FVAEE75 pKa = 4.81GPLEE79 pKa = 4.03LQVATEE85 pKa = 4.32ANAQVWYY92 pKa = 7.9FTLEE96 pKa = 3.86AEE98 pKa = 4.91QATEE102 pKa = 3.98ANGEE106 pKa = 4.17EE107 pKa = 4.27TQSFAKK113 pKa = 10.41LHH115 pKa = 5.18TPRR118 pKa = 11.84ARR120 pKa = 11.84DD121 pKa = 3.22HH122 pKa = 6.47RR123 pKa = 11.84AEE125 pKa = 3.87MMQFQLQQQQMAFMEE140 pKa = 4.25QMRR143 pKa = 11.84AEE145 pKa = 4.46FDD147 pKa = 3.04RR148 pKa = 11.84RR149 pKa = 11.84LAANPGVHH157 pKa = 6.52PVTGEE162 pKa = 3.84VIEE165 pKa = 4.31DD166 pKa = 3.44VKK168 pKa = 10.97PSSEE172 pKa = 4.07AFGTSGTDD180 pKa = 3.2VSEE183 pKa = 4.42SDD185 pKa = 3.45AVAGADD191 pKa = 3.59EE192 pKa = 4.68PVAEE196 pKa = 4.64PVDD199 pKa = 3.91AKK201 pKa = 10.89AGKK204 pKa = 9.7
MM1 pKa = 7.45TIKK4 pKa = 10.81NLGEE8 pKa = 3.91VFAMRR13 pKa = 11.84RR14 pKa = 11.84LEE16 pKa = 4.3GGSLILPKK24 pKa = 9.07EE25 pKa = 4.1TRR27 pKa = 11.84RR28 pKa = 11.84KK29 pKa = 9.8VRR31 pKa = 11.84IEE33 pKa = 4.08FNVDD37 pKa = 2.93TPASVYY43 pKa = 10.81AIDD46 pKa = 4.85RR47 pKa = 11.84GQDD50 pKa = 3.38GPGDD54 pKa = 3.73LSSSRR59 pKa = 11.84FIADD63 pKa = 3.32LDD65 pKa = 3.91GFTVLEE71 pKa = 4.86FVAEE75 pKa = 4.81GPLEE79 pKa = 4.03LQVATEE85 pKa = 4.32ANAQVWYY92 pKa = 7.9FTLEE96 pKa = 3.86AEE98 pKa = 4.91QATEE102 pKa = 3.98ANGEE106 pKa = 4.17EE107 pKa = 4.27TQSFAKK113 pKa = 10.41LHH115 pKa = 5.18TPRR118 pKa = 11.84ARR120 pKa = 11.84DD121 pKa = 3.22HH122 pKa = 6.47RR123 pKa = 11.84AEE125 pKa = 3.87MMQFQLQQQQMAFMEE140 pKa = 4.25QMRR143 pKa = 11.84AEE145 pKa = 4.46FDD147 pKa = 3.04RR148 pKa = 11.84RR149 pKa = 11.84LAANPGVHH157 pKa = 6.52PVTGEE162 pKa = 3.84VIEE165 pKa = 4.31DD166 pKa = 3.44VKK168 pKa = 10.97PSSEE172 pKa = 4.07AFGTSGTDD180 pKa = 3.2VSEE183 pKa = 4.42SDD185 pKa = 3.45AVAGADD191 pKa = 3.59EE192 pKa = 4.68PVAEE196 pKa = 4.64PVDD199 pKa = 3.91AKK201 pKa = 10.89AGKK204 pKa = 9.7
Molecular weight: 22.36 kDa
Isoelectric point according different methods:
Protein with the highest isoelectric point:
>tr|A0A4P8W7R9|A0A4P8W7R9_9VIRU Uncharacterized protein OS=Tortoise microvirus 79 OX=2583186 PE=4 SV=1
MM1 pKa = 7.36EE2 pKa = 5.9ASTMARR8 pKa = 11.84RR9 pKa = 11.84SGSRR13 pKa = 11.84RR14 pKa = 11.84EE15 pKa = 3.71SRR17 pKa = 11.84RR18 pKa = 11.84RR19 pKa = 11.84NFLSEE24 pKa = 3.5ASYY27 pKa = 10.7GRR29 pKa = 11.84RR30 pKa = 11.84VAAPQRR36 pKa = 11.84RR37 pKa = 11.84ITTLQPIGRR46 pKa = 11.84PRR48 pKa = 11.84PYY50 pKa = 9.66VQAEE54 pKa = 3.75HH55 pKa = 6.79RR56 pKa = 11.84RR57 pKa = 11.84FGRR60 pKa = 11.84VPQIAPSVISSGQILGGPISAGTGRR85 pKa = 11.84YY86 pKa = 7.37QRR88 pKa = 11.84PEE90 pKa = 3.82EE91 pKa = 4.0PAFLTPNNRR100 pKa = 11.84TTLPDD105 pKa = 3.37NRR107 pKa = 11.84LSSHH111 pKa = 4.65MTRR114 pKa = 11.84NTMCNRR120 pKa = 11.84RR121 pKa = 11.84PDD123 pKa = 3.29SRR125 pKa = 11.84SARR128 pKa = 11.84RR129 pKa = 11.84GNGGSKK135 pKa = 10.26RR136 pKa = 11.84FVPWCC141 pKa = 3.92
MM1 pKa = 7.36EE2 pKa = 5.9ASTMARR8 pKa = 11.84RR9 pKa = 11.84SGSRR13 pKa = 11.84RR14 pKa = 11.84EE15 pKa = 3.71SRR17 pKa = 11.84RR18 pKa = 11.84RR19 pKa = 11.84NFLSEE24 pKa = 3.5ASYY27 pKa = 10.7GRR29 pKa = 11.84RR30 pKa = 11.84VAAPQRR36 pKa = 11.84RR37 pKa = 11.84ITTLQPIGRR46 pKa = 11.84PRR48 pKa = 11.84PYY50 pKa = 9.66VQAEE54 pKa = 3.75HH55 pKa = 6.79RR56 pKa = 11.84RR57 pKa = 11.84FGRR60 pKa = 11.84VPQIAPSVISSGQILGGPISAGTGRR85 pKa = 11.84YY86 pKa = 7.37QRR88 pKa = 11.84PEE90 pKa = 3.82EE91 pKa = 4.0PAFLTPNNRR100 pKa = 11.84TTLPDD105 pKa = 3.37NRR107 pKa = 11.84LSSHH111 pKa = 4.65MTRR114 pKa = 11.84NTMCNRR120 pKa = 11.84RR121 pKa = 11.84PDD123 pKa = 3.29SRR125 pKa = 11.84SARR128 pKa = 11.84RR129 pKa = 11.84GNGGSKK135 pKa = 10.26RR136 pKa = 11.84FVPWCC141 pKa = 3.92
Molecular weight: 15.93 kDa
Isoelectric point according different methods:
Peptides (in silico digests for buttom-up proteomics)
Below you can find in silico digests of the whole proteome with Trypsin, Chymotrypsin, Trypsin+LysC, LysN, ArgC proteases suitable for different mass spec machines.| Try ESI |
 |
|---|
| ChTry ESI |
|
|---|
| ArgC ESI |
|
|---|
| LysN ESI |
|
|---|
| TryLysC ESI |
|
|---|
| Try MALDI |
|
|---|
| ChTry MALDI |
|
|---|
| ArgC MALDI |
|
|---|
| LysN MALDI |
|
|---|
| TryLysC MALDI |
|
|---|
| Try LTQ |
|
|---|
| ChTry LTQ |
|
|---|
| ArgC LTQ |
|
|---|
| LysN LTQ |
|
|---|
| TryLysC LTQ |
|
|---|
| Try MSlow |
|
|---|
| ChTry MSlow |
|
|---|
| ArgC MSlow |
|
|---|
| LysN MSlow |
|
|---|
| TryLysC MSlow |
|
|---|
| Try MShigh |
|
|---|
| ChTry MShigh |
|
|---|
| ArgC MShigh |
|
|---|
| LysN MShigh |
|
|---|
| TryLysC MShigh |
|
|---|
General Statistics
Number of major isoforms |
Number of additional isoforms |
Number of all proteins |
Number of amino acids |
Min. Seq. Length |
Max. Seq. Length |
Avg. Seq. Length |
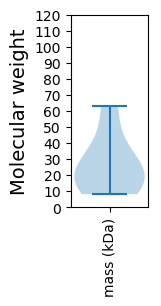
Avg. Mol. Weight |
|---|---|---|---|---|---|---|---|
0 |
1889 |
75 |
565 |
236.1 |
26.35 |
Amino acid frequency
Ala |
Cys |
Asp |
Glu |
Phe |
Gly |
His |
Ile |
Lys |
Leu |
|---|---|---|---|---|---|---|---|---|---|
9.688 ± 0.784 | 0.476 ± 0.349 |
4.976 ± 0.694 | 6.935 ± 0.863 |
3.441 ± 0.349 | 7.782 ± 1.21 |
2.912 ± 0.428 | 4.235 ± 0.453 |
3.917 ± 1.035 | 7.835 ± 0.506 |
Met |
Asn |
Gln |
Pro |
Arg |
Ser |
Thr |
Val |
Trp |
Tyr |
|---|---|---|---|---|---|---|---|---|---|
3.6 ± 0.294 | 3.864 ± 1.014 |
5.717 ± 0.553 | 4.659 ± 0.41 |
7.2 ± 1.359 | 6.458 ± 0.459 |
4.553 ± 0.55 | 7.041 ± 0.494 |
2.065 ± 0.465 | 2.647 ± 0.757 |
Most of the basic statistics you can see at this page can be downloaded from this CSV file
See this proteome in:

Proteome-pI is available under Creative Commons Attribution-NoDerivs license, for more details see here
| Reference: Kozlowski LP. Proteome-pI 2.0: Proteome Isoelectric Point Database Update. Nucleic Acids Res. 2021, doi: 10.1093/nar/gkab944 | Contact: Lukasz P. Kozlowski |