Rhodobacter vinaykumarii
Taxonomy: cellular organisms; Bacteria; Proteobacteria; Alphaproteobacteria; Rhodobacterales; Rhodobacteraceae; Bieblia
Average proteome isoelectric point is 6.51
Get precalculated fractions of proteins
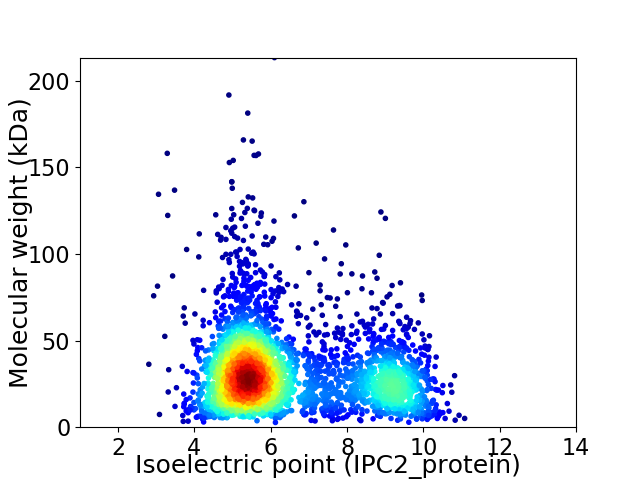
Virtual 2D-PAGE plot for 3255 proteins (isoelectric point calculated using IPC2_protein)
Get csv file with sequences according to given criteria:
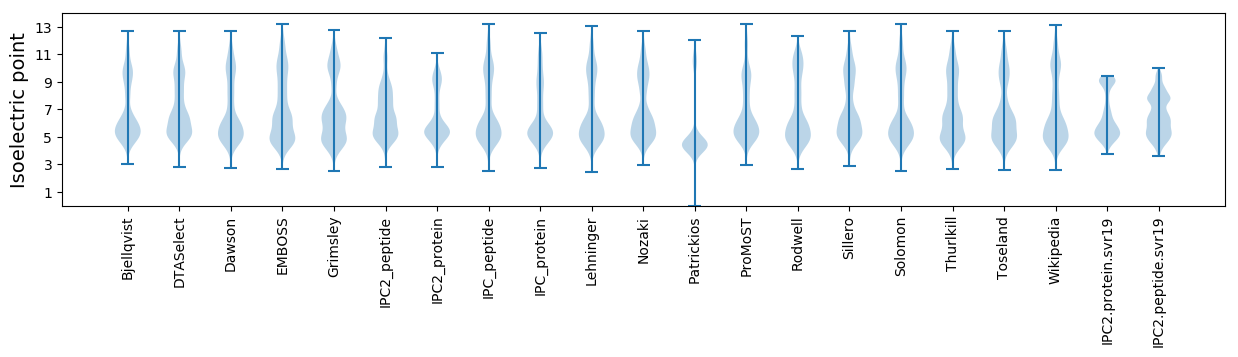
* You can choose from 21 different methods for calculating isoelectric point
Summary statistics related to proteome-wise predictions
Protein with the lowest isoelectric point:
>tr|A0A1N7KQQ1|A0A1N7KQQ1_9RHOB Uncharacterized protein OS=Rhodobacter vinaykumarii OX=407234 GN=SAMN05421795_10255 PE=4 SV=1
MM1 pKa = 7.63KK2 pKa = 10.41KK3 pKa = 10.44LLLASTALVMTAGVASAEE21 pKa = 4.11MTIGGSAEE29 pKa = 3.9MGFQGGDD36 pKa = 3.37FYY38 pKa = 11.81GVGTDD43 pKa = 4.8DD44 pKa = 5.67LSFHH48 pKa = 6.64QDD50 pKa = 3.03YY51 pKa = 11.23SIDD54 pKa = 3.42IKK56 pKa = 11.2GTGTTDD62 pKa = 2.69AGLEE66 pKa = 4.03FGFTFSLQGDD76 pKa = 4.11GNVRR80 pKa = 11.84TRR82 pKa = 11.84NDD84 pKa = 2.88IAGDD88 pKa = 3.63NEE90 pKa = 4.56TVFIGGAFGKK100 pKa = 8.77LTMGDD105 pKa = 3.14TDD107 pKa = 5.08GAFDD111 pKa = 3.43WAMTEE116 pKa = 3.98VNLAGGSIADD126 pKa = 4.78DD127 pKa = 3.88EE128 pKa = 4.76TTHH131 pKa = 7.37GGFNGNAAFDD141 pKa = 4.16GQNDD145 pKa = 4.08DD146 pKa = 3.06QVLRR150 pKa = 11.84YY151 pKa = 8.7EE152 pKa = 4.32YY153 pKa = 11.61AMGAFGFALSYY164 pKa = 10.65EE165 pKa = 4.23QFAQGQSVPGVDD177 pKa = 3.86ADD179 pKa = 3.96DD180 pKa = 4.9SIGVGLKK187 pKa = 10.58YY188 pKa = 9.35STQMSTVALDD198 pKa = 3.74FGLGYY203 pKa = 9.8QQGAATAIGPYY214 pKa = 9.38TLVSRR219 pKa = 11.84TNGDD223 pKa = 3.44VIGASVKK230 pKa = 10.75ADD232 pKa = 3.87FGNGFLAGLNYY243 pKa = 10.36SSYY246 pKa = 11.25DD247 pKa = 3.3FEE249 pKa = 6.25ARR251 pKa = 11.84DD252 pKa = 3.64VTGVLTNTPDD262 pKa = 3.43ATHH265 pKa = 6.53MGLGVAYY272 pKa = 6.98TTGPWTVAANYY283 pKa = 9.61GKK285 pKa = 10.89YY286 pKa = 10.48DD287 pKa = 3.46VDD289 pKa = 3.85AVNADD294 pKa = 3.29VTGYY298 pKa = 10.96GLVVNYY304 pKa = 10.24DD305 pKa = 3.56LGGGAVVQAGYY316 pKa = 10.39GATDD320 pKa = 4.11FEE322 pKa = 5.27APAANDD328 pKa = 3.65TEE330 pKa = 4.81SYY332 pKa = 10.43SIGVAMSFF340 pKa = 3.82
MM1 pKa = 7.63KK2 pKa = 10.41KK3 pKa = 10.44LLLASTALVMTAGVASAEE21 pKa = 4.11MTIGGSAEE29 pKa = 3.9MGFQGGDD36 pKa = 3.37FYY38 pKa = 11.81GVGTDD43 pKa = 4.8DD44 pKa = 5.67LSFHH48 pKa = 6.64QDD50 pKa = 3.03YY51 pKa = 11.23SIDD54 pKa = 3.42IKK56 pKa = 11.2GTGTTDD62 pKa = 2.69AGLEE66 pKa = 4.03FGFTFSLQGDD76 pKa = 4.11GNVRR80 pKa = 11.84TRR82 pKa = 11.84NDD84 pKa = 2.88IAGDD88 pKa = 3.63NEE90 pKa = 4.56TVFIGGAFGKK100 pKa = 8.77LTMGDD105 pKa = 3.14TDD107 pKa = 5.08GAFDD111 pKa = 3.43WAMTEE116 pKa = 3.98VNLAGGSIADD126 pKa = 4.78DD127 pKa = 3.88EE128 pKa = 4.76TTHH131 pKa = 7.37GGFNGNAAFDD141 pKa = 4.16GQNDD145 pKa = 4.08DD146 pKa = 3.06QVLRR150 pKa = 11.84YY151 pKa = 8.7EE152 pKa = 4.32YY153 pKa = 11.61AMGAFGFALSYY164 pKa = 10.65EE165 pKa = 4.23QFAQGQSVPGVDD177 pKa = 3.86ADD179 pKa = 3.96DD180 pKa = 4.9SIGVGLKK187 pKa = 10.58YY188 pKa = 9.35STQMSTVALDD198 pKa = 3.74FGLGYY203 pKa = 9.8QQGAATAIGPYY214 pKa = 9.38TLVSRR219 pKa = 11.84TNGDD223 pKa = 3.44VIGASVKK230 pKa = 10.75ADD232 pKa = 3.87FGNGFLAGLNYY243 pKa = 10.36SSYY246 pKa = 11.25DD247 pKa = 3.3FEE249 pKa = 6.25ARR251 pKa = 11.84DD252 pKa = 3.64VTGVLTNTPDD262 pKa = 3.43ATHH265 pKa = 6.53MGLGVAYY272 pKa = 6.98TTGPWTVAANYY283 pKa = 9.61GKK285 pKa = 10.89YY286 pKa = 10.48DD287 pKa = 3.46VDD289 pKa = 3.85AVNADD294 pKa = 3.29VTGYY298 pKa = 10.96GLVVNYY304 pKa = 10.24DD305 pKa = 3.56LGGGAVVQAGYY316 pKa = 10.39GATDD320 pKa = 4.11FEE322 pKa = 5.27APAANDD328 pKa = 3.65TEE330 pKa = 4.81SYY332 pKa = 10.43SIGVAMSFF340 pKa = 3.82
Molecular weight: 35.12 kDa
Isoelectric point according different methods:
Protein with the highest isoelectric point:
>tr|A0A1N7JQ12|A0A1N7JQ12_9RHOB Ferric uptake regulation protein OS=Rhodobacter vinaykumarii OX=407234 GN=fur PE=3 SV=1
MM1 pKa = 7.16PRR3 pKa = 11.84KK4 pKa = 9.4RR5 pKa = 11.84QAAMPRR11 pKa = 11.84KK12 pKa = 9.26SQAALPRR19 pKa = 11.84GGQVAMPRR27 pKa = 11.84IGQAAMPRR35 pKa = 11.84GGHH38 pKa = 6.4RR39 pKa = 11.84ATPGNRR45 pKa = 11.84ATPGNDD51 pKa = 2.82APANRR56 pKa = 11.84PAVARR61 pKa = 11.84AGRR64 pKa = 11.84ARR66 pKa = 3.45
MM1 pKa = 7.16PRR3 pKa = 11.84KK4 pKa = 9.4RR5 pKa = 11.84QAAMPRR11 pKa = 11.84KK12 pKa = 9.26SQAALPRR19 pKa = 11.84GGQVAMPRR27 pKa = 11.84IGQAAMPRR35 pKa = 11.84GGHH38 pKa = 6.4RR39 pKa = 11.84ATPGNRR45 pKa = 11.84ATPGNDD51 pKa = 2.82APANRR56 pKa = 11.84PAVARR61 pKa = 11.84AGRR64 pKa = 11.84ARR66 pKa = 3.45
Molecular weight: 6.89 kDa
Isoelectric point according different methods:
Peptides (in silico digests for buttom-up proteomics)
Below you can find in silico digests of the whole proteome with Trypsin, Chymotrypsin, Trypsin+LysC, LysN, ArgC proteases suitable for different mass spec machines.| Try ESI |
 |
|---|
| ChTry ESI |
|
|---|
| ArgC ESI |
|
|---|
| LysN ESI |
|
|---|
| TryLysC ESI |
|
|---|
| Try MALDI |
|
|---|
| ChTry MALDI |
|
|---|
| ArgC MALDI |
|
|---|
| LysN MALDI |
|
|---|
| TryLysC MALDI |
|
|---|
| Try LTQ |
|
|---|
| ChTry LTQ |
|
|---|
| ArgC LTQ |
|
|---|
| LysN LTQ |
|
|---|
| TryLysC LTQ |
|
|---|
| Try MSlow |
|
|---|
| ChTry MSlow |
|
|---|
| ArgC MSlow |
|
|---|
| LysN MSlow |
|
|---|
| TryLysC MSlow |
|
|---|
| Try MShigh |
|
|---|
| ChTry MShigh |
|
|---|
| ArgC MShigh |
|
|---|
| LysN MShigh |
|
|---|
| TryLysC MShigh |
|
|---|
General Statistics
Number of major isoforms |
Number of additional isoforms |
Number of all proteins |
Number of amino acids |
Min. Seq. Length |
Max. Seq. Length |
Avg. Seq. Length |
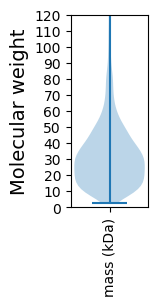
Avg. Mol. Weight |
|---|---|---|---|---|---|---|---|
0 |
1023962 |
25 |
1967 |
314.6 |
33.82 |
Amino acid frequency
Ala |
Cys |
Asp |
Glu |
Phe |
Gly |
His |
Ile |
Lys |
Leu |
|---|---|---|---|---|---|---|---|---|---|
14.465 ± 0.08 | 0.831 ± 0.015 |
5.777 ± 0.044 | 5.803 ± 0.047 |
3.404 ± 0.024 | 9.092 ± 0.054 |
2.037 ± 0.022 | 4.6 ± 0.031 |
2.41 ± 0.037 | 10.386 ± 0.051 |
Met |
Asn |
Gln |
Pro |
Arg |
Ser |
Thr |
Val |
Trp |
Tyr |
|---|---|---|---|---|---|---|---|---|---|
2.615 ± 0.022 | 2.091 ± 0.022 |
5.794 ± 0.042 | 2.827 ± 0.024 |
7.863 ± 0.045 | 4.519 ± 0.028 |
5.149 ± 0.03 | 7.074 ± 0.032 |
1.383 ± 0.018 | 1.88 ± 0.019 |
Most of the basic statistics you can see at this page can be downloaded from this CSV file
See this proteome in:

Proteome-pI is available under Creative Commons Attribution-NoDerivs license, for more details see here
| Reference: Kozlowski LP. Proteome-pI 2.0: Proteome Isoelectric Point Database Update. Nucleic Acids Res. 2021, doi: 10.1093/nar/gkab944 | Contact: Lukasz P. Kozlowski |