Sweet potato chlorotic stunt virus
Taxonomy: Viruses; Riboviria; Orthornavirae; Kitrinoviricota; Alsuviricetes; Martellivirales; Closteroviridae; Crinivirus
Average proteome isoelectric point is 6.86
Get precalculated fractions of proteins
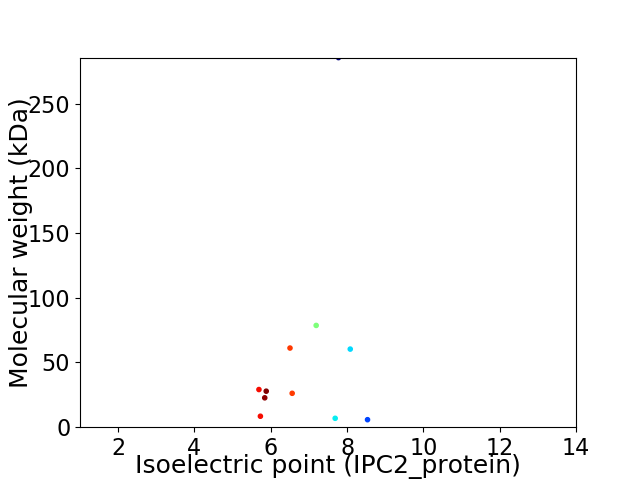
Virtual 2D-PAGE plot for 11 proteins (isoelectric point calculated using IPC2_protein)
Get csv file with sequences according to given criteria:
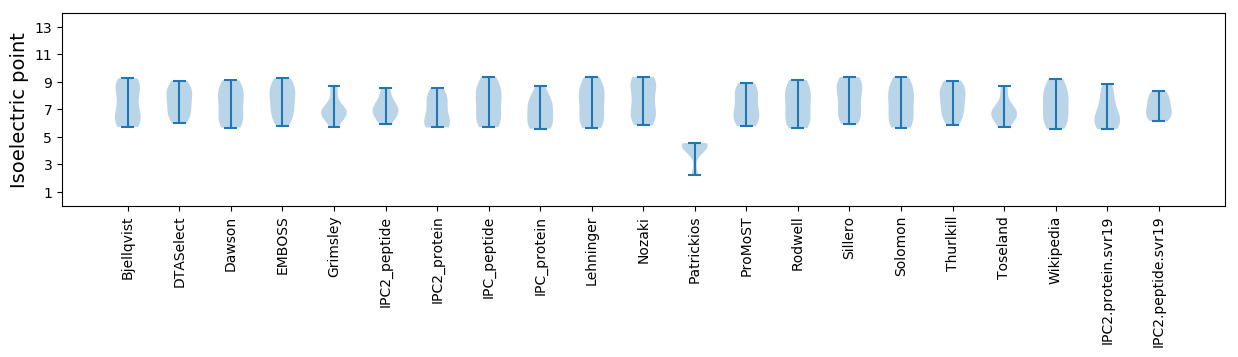
* You can choose from 21 different methods for calculating isoelectric point
Summary statistics related to proteome-wise predictions
Protein with the lowest isoelectric point:
>tr|Q8JJW3|Q8JJW3_9CLOS Putative movement protein OS=Sweet potato chlorotic stunt virus OX=81931 GN=p60 PE=4 SV=1
MM1 pKa = 7.94DD2 pKa = 4.55FSEE5 pKa = 5.77LIEE8 pKa = 4.41KK9 pKa = 10.67YY10 pKa = 9.3GVEE13 pKa = 4.5RR14 pKa = 11.84ISSLTSRR21 pKa = 11.84LLEE24 pKa = 3.93IKK26 pKa = 9.46RR27 pKa = 11.84TGVGLVNLLLNLINEE42 pKa = 4.15NFVYY46 pKa = 10.56FDD48 pKa = 4.21SNRR51 pKa = 11.84SKK53 pKa = 11.1CGFEE57 pKa = 4.74KK58 pKa = 10.31EE59 pKa = 4.04DD60 pKa = 3.84HH61 pKa = 6.3VLILQIIPLLRR72 pKa = 11.84II73 pKa = 3.69
MM1 pKa = 7.94DD2 pKa = 4.55FSEE5 pKa = 5.77LIEE8 pKa = 4.41KK9 pKa = 10.67YY10 pKa = 9.3GVEE13 pKa = 4.5RR14 pKa = 11.84ISSLTSRR21 pKa = 11.84LLEE24 pKa = 3.93IKK26 pKa = 9.46RR27 pKa = 11.84TGVGLVNLLLNLINEE42 pKa = 4.15NFVYY46 pKa = 10.56FDD48 pKa = 4.21SNRR51 pKa = 11.84SKK53 pKa = 11.1CGFEE57 pKa = 4.74KK58 pKa = 10.31EE59 pKa = 4.04DD60 pKa = 3.84HH61 pKa = 6.3VLILQIIPLLRR72 pKa = 11.84II73 pKa = 3.69
Molecular weight: 8.47 kDa
Isoelectric point according different methods:
Protein with the highest isoelectric point:
>tr|Q8JJW6|Q8JJW6_9CLOS p22 protein OS=Sweet potato chlorotic stunt virus OX=81931 GN=p22 PE=4 SV=1
MM1 pKa = 6.45TQSIRR6 pKa = 11.84EE7 pKa = 4.16SMGLCNPRR15 pKa = 11.84TRR17 pKa = 11.84ISVTYY22 pKa = 9.68WMQSDD27 pKa = 4.29CPSYY31 pKa = 11.34LLLFCVYY38 pKa = 10.22KK39 pKa = 10.9SKK41 pKa = 7.76TQKK44 pKa = 10.96YY45 pKa = 8.95IFSPP49 pKa = 3.71
MM1 pKa = 6.45TQSIRR6 pKa = 11.84EE7 pKa = 4.16SMGLCNPRR15 pKa = 11.84TRR17 pKa = 11.84ISVTYY22 pKa = 9.68WMQSDD27 pKa = 4.29CPSYY31 pKa = 11.34LLLFCVYY38 pKa = 10.22KK39 pKa = 10.9SKK41 pKa = 7.76TQKK44 pKa = 10.96YY45 pKa = 8.95IFSPP49 pKa = 3.71
Molecular weight: 5.8 kDa
Isoelectric point according different methods:
Peptides (in silico digests for buttom-up proteomics)
Below you can find in silico digests of the whole proteome with Trypsin, Chymotrypsin, Trypsin+LysC, LysN, ArgC proteases suitable for different mass spec machines.| Try ESI |
 |
|---|
| ChTry ESI |
|
|---|
| ArgC ESI |
|
|---|
| LysN ESI |
|
|---|
| TryLysC ESI |
|
|---|
| Try MALDI |
|
|---|
| ChTry MALDI |
|
|---|
| ArgC MALDI |
|
|---|
| LysN MALDI |
|
|---|
| TryLysC MALDI |
|
|---|
| Try LTQ |
|
|---|
| ChTry LTQ |
|
|---|
| ArgC LTQ |
|
|---|
| LysN LTQ |
|
|---|
| TryLysC LTQ |
|
|---|
| Try MSlow |
|
|---|
| ChTry MSlow |
|
|---|
| ArgC MSlow |
|
|---|
| LysN MSlow |
|
|---|
| TryLysC MSlow |
|
|---|
| Try MShigh |
|
|---|
| ChTry MShigh |
|
|---|
| ArgC MShigh |
|
|---|
| LysN MShigh |
|
|---|
| TryLysC MShigh |
|
|---|
General Statistics
Number of major isoforms |
Number of additional isoforms |
Number of all proteins |
Number of amino acids |
Min. Seq. Length |
Max. Seq. Length |
Avg. Seq. Length |
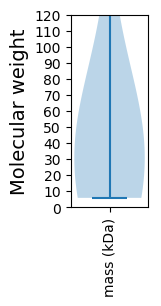
Avg. Mol. Weight |
|---|---|---|---|---|---|---|---|
0 |
5346 |
49 |
2492 |
486.0 |
55.68 |
Amino acid frequency
Ala |
Cys |
Asp |
Glu |
Phe |
Gly |
His |
Ile |
Lys |
Leu |
|---|---|---|---|---|---|---|---|---|---|
4.34 ± 0.466 | 1.945 ± 0.265 |
6.828 ± 0.194 | 5.275 ± 0.307 |
6.117 ± 0.245 | 4.564 ± 0.28 |
1.871 ± 0.237 | 5.593 ± 0.474 |
7.632 ± 0.568 | 9.802 ± 0.518 |
Met |
Asn |
Gln |
Pro |
Arg |
Ser |
Thr |
Val |
Trp |
Tyr |
|---|---|---|---|---|---|---|---|---|---|
2.825 ± 0.201 | 5.986 ± 0.57 |
3.049 ± 0.249 | 2.376 ± 0.182 |
5.238 ± 0.17 | 8.511 ± 0.65 |
5.238 ± 0.22 | 7.987 ± 0.528 |
0.767 ± 0.179 | 4.059 ± 0.303 |
Most of the basic statistics you can see at this page can be downloaded from this CSV file
See this proteome in:

Proteome-pI is available under Creative Commons Attribution-NoDerivs license, for more details see here
| Reference: Kozlowski LP. Proteome-pI 2.0: Proteome Isoelectric Point Database Update. Nucleic Acids Res. 2021, doi: 10.1093/nar/gkab944 | Contact: Lukasz P. Kozlowski |