Sneathia vaginalis
Taxonomy: cellular organisms;
Average proteome isoelectric point is 7.09
Get precalculated fractions of proteins
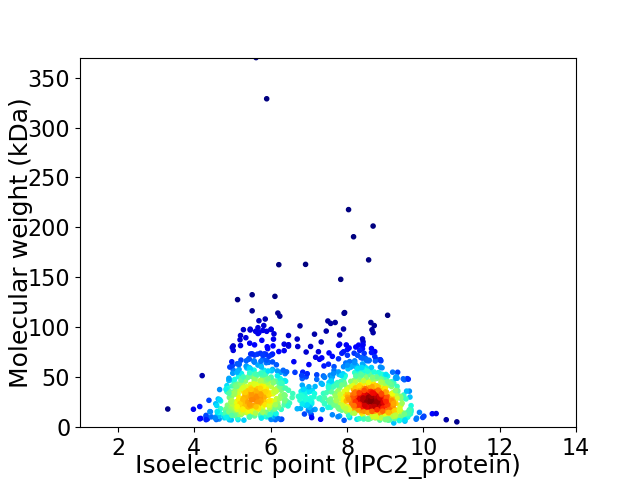
Virtual 2D-PAGE plot for 1182 proteins (isoelectric point calculated using IPC2_protein)
Get csv file with sequences according to given criteria:
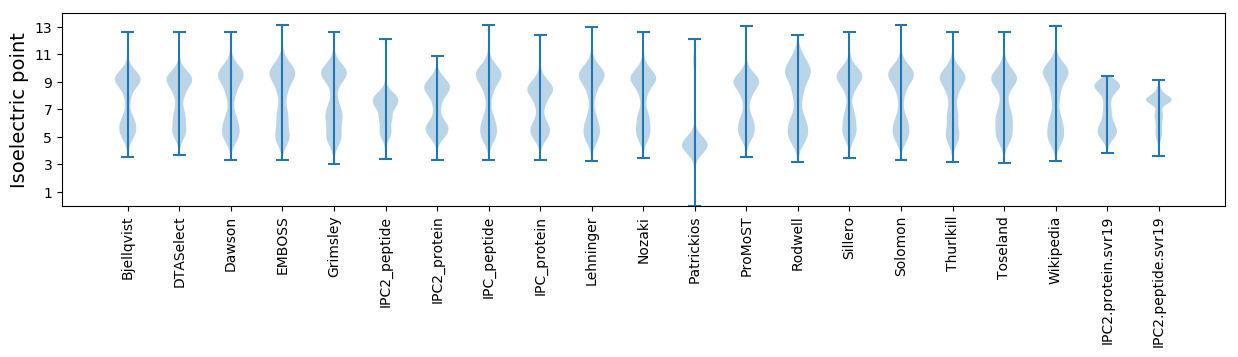
* You can choose from 21 different methods for calculating isoelectric point
Summary statistics related to proteome-wise predictions
Protein with the lowest isoelectric point:
>tr|A0A0E3ZB37|A0A0E3ZB37_9FUSO Glucose-1-phosphate adenylyltransferase OS=Sneathia vaginalis OX=187101 GN=glgC PE=3 SV=1
MM1 pKa = 7.67KK2 pKa = 10.41KK3 pKa = 10.09RR4 pKa = 11.84VTGDD8 pKa = 3.27MNILEE13 pKa = 4.73AVEE16 pKa = 4.48KK17 pKa = 10.39YY18 pKa = 10.53PIIAEE23 pKa = 3.87VLMRR27 pKa = 11.84YY28 pKa = 9.84GLGCSGCFISEE39 pKa = 4.09MEE41 pKa = 4.22TVYY44 pKa = 11.15DD45 pKa = 4.78GIAVHH50 pKa = 6.65GLDD53 pKa = 3.82PDD55 pKa = 3.8IVIDD59 pKa = 4.7EE60 pKa = 4.25INMLIEE66 pKa = 3.89MQEE69 pKa = 3.96NGEE72 pKa = 4.0LDD74 pKa = 3.74YY75 pKa = 11.76
MM1 pKa = 7.67KK2 pKa = 10.41KK3 pKa = 10.09RR4 pKa = 11.84VTGDD8 pKa = 3.27MNILEE13 pKa = 4.73AVEE16 pKa = 4.48KK17 pKa = 10.39YY18 pKa = 10.53PIIAEE23 pKa = 3.87VLMRR27 pKa = 11.84YY28 pKa = 9.84GLGCSGCFISEE39 pKa = 4.09MEE41 pKa = 4.22TVYY44 pKa = 11.15DD45 pKa = 4.78GIAVHH50 pKa = 6.65GLDD53 pKa = 3.82PDD55 pKa = 3.8IVIDD59 pKa = 4.7EE60 pKa = 4.25INMLIEE66 pKa = 3.89MQEE69 pKa = 3.96NGEE72 pKa = 4.0LDD74 pKa = 3.74YY75 pKa = 11.76
Molecular weight: 8.44 kDa
Isoelectric point according different methods:
Protein with the highest isoelectric point:
>tr|A0A0E3Z978|A0A0E3Z978_9FUSO Uncharacterized protein OS=Sneathia vaginalis OX=187101 GN=VC03_00030 PE=4 SV=1
MM1 pKa = 7.44KK2 pKa = 9.6RR3 pKa = 11.84TFQPNNRR10 pKa = 11.84KK11 pKa = 9.35RR12 pKa = 11.84KK13 pKa = 8.02KK14 pKa = 9.9DD15 pKa = 2.97HH16 pKa = 6.23GFRR19 pKa = 11.84LRR21 pKa = 11.84MKK23 pKa = 9.07TKK25 pKa = 10.2SGRR28 pKa = 11.84NVLKK32 pKa = 10.44RR33 pKa = 11.84RR34 pKa = 11.84RR35 pKa = 11.84NKK37 pKa = 9.69GRR39 pKa = 11.84AKK41 pKa = 10.67LSAA44 pKa = 3.92
MM1 pKa = 7.44KK2 pKa = 9.6RR3 pKa = 11.84TFQPNNRR10 pKa = 11.84KK11 pKa = 9.35RR12 pKa = 11.84KK13 pKa = 8.02KK14 pKa = 9.9DD15 pKa = 2.97HH16 pKa = 6.23GFRR19 pKa = 11.84LRR21 pKa = 11.84MKK23 pKa = 9.07TKK25 pKa = 10.2SGRR28 pKa = 11.84NVLKK32 pKa = 10.44RR33 pKa = 11.84RR34 pKa = 11.84RR35 pKa = 11.84NKK37 pKa = 9.69GRR39 pKa = 11.84AKK41 pKa = 10.67LSAA44 pKa = 3.92
Molecular weight: 5.35 kDa
Isoelectric point according different methods:
Peptides (in silico digests for buttom-up proteomics)
Below you can find in silico digests of the whole proteome with Trypsin, Chymotrypsin, Trypsin+LysC, LysN, ArgC proteases suitable for different mass spec machines.| Try ESI |
 |
|---|
| ChTry ESI |
|
|---|
| ArgC ESI |
|
|---|
| LysN ESI |
|
|---|
| TryLysC ESI |
|
|---|
| Try MALDI |
|
|---|
| ChTry MALDI |
|
|---|
| ArgC MALDI |
|
|---|
| LysN MALDI |
|
|---|
| TryLysC MALDI |
|
|---|
| Try LTQ |
|
|---|
| ChTry LTQ |
|
|---|
| ArgC LTQ |
|
|---|
| LysN LTQ |
|
|---|
| TryLysC LTQ |
|
|---|
| Try MSlow |
|
|---|
| ChTry MSlow |
|
|---|
| ArgC MSlow |
|
|---|
| LysN MSlow |
|
|---|
| TryLysC MSlow |
|
|---|
| Try MShigh |
|
|---|
| ChTry MShigh |
|
|---|
| ArgC MShigh |
|
|---|
| LysN MShigh |
|
|---|
| TryLysC MShigh |
|
|---|
General Statistics
Number of major isoforms |
Number of additional isoforms |
Number of all proteins |
Number of amino acids |
Min. Seq. Length |
Max. Seq. Length |
Avg. Seq. Length |
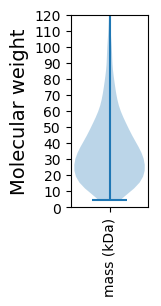
Avg. Mol. Weight |
|---|---|---|---|---|---|---|---|
0 |
391510 |
37 |
3402 |
331.2 |
37.65 |
Amino acid frequency
Ala |
Cys |
Asp |
Glu |
Phe |
Gly |
His |
Ile |
Lys |
Leu |
|---|---|---|---|---|---|---|---|---|---|
5.117 ± 0.071 | 0.864 ± 0.025 |
5.855 ± 0.057 | 7.148 ± 0.071 |
4.375 ± 0.062 | 5.996 ± 0.093 |
1.296 ± 0.023 | 9.755 ± 0.087 |
10.515 ± 0.076 | 9.412 ± 0.072 |
Met |
Asn |
Gln |
Pro |
Arg |
Ser |
Thr |
Val |
Trp |
Tyr |
|---|---|---|---|---|---|---|---|---|---|
2.344 ± 0.035 | 6.597 ± 0.087 |
2.439 ± 0.041 | 2.208 ± 0.032 |
3.218 ± 0.039 | 6.043 ± 0.06 |
5.131 ± 0.054 | 6.497 ± 0.067 |
0.509 ± 0.021 | 4.683 ± 0.063 |
Most of the basic statistics you can see at this page can be downloaded from this CSV file
See this proteome in:

Proteome-pI is available under Creative Commons Attribution-NoDerivs license, for more details see here
| Reference: Kozlowski LP. Proteome-pI 2.0: Proteome Isoelectric Point Database Update. Nucleic Acids Res. 2021, doi: 10.1093/nar/gkab944 | Contact: Lukasz P. Kozlowski |