Aegilops tauschii subsp. strangulata (Goatgrass)
Taxonomy: cellular organisms; Eukaryota; Viridiplantae; Streptophyta; Streptophytina; Embryophyta; Tracheophyta; Euphyllophyta; Spermatophyta; Magnoliopsida; Mesangiospermae; Liliopsida; Petrosaviidae; commelinids; Poales; Poaceae; BOP clade; Pooideae; Triticodae; Triticeae; Triticinae; Aegilops; Aegilops tauschii
Average proteome isoelectric point is 6.86
Get precalculated fractions of proteins
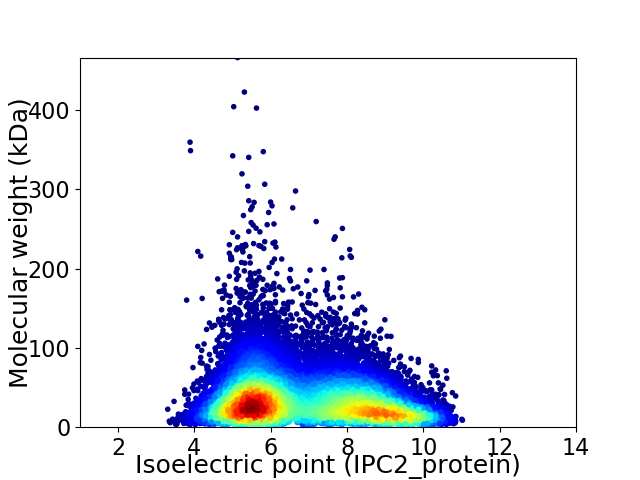
Virtual 2D-PAGE plot for 214162 proteins (isoelectric point calculated using IPC2_protein)
Get csv file with sequences according to given criteria:
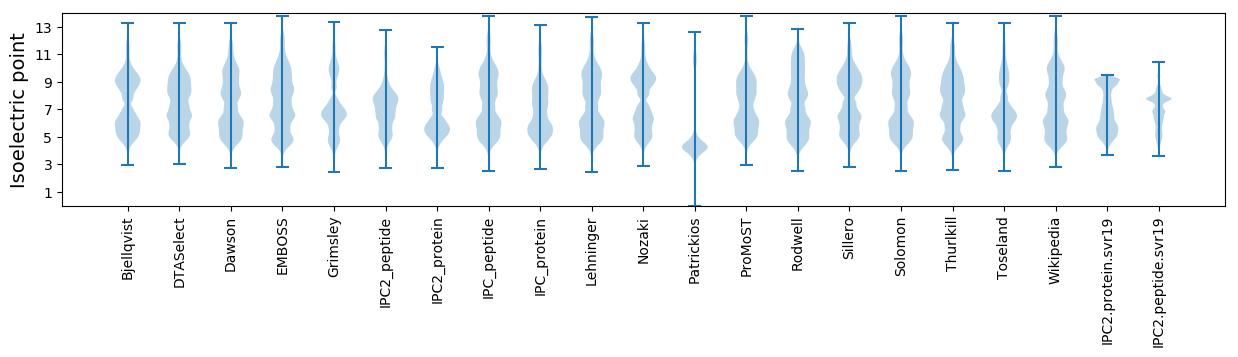
* You can choose from 21 different methods for calculating isoelectric point
Summary statistics related to proteome-wise predictions
Protein with the lowest isoelectric point:
>tr|A0A453A9N1|A0A453A9N1_AEGTS Protein kinase domain-containing protein OS=Aegilops tauschii subsp. strangulata OX=200361 PE=4 SV=1
MM1 pKa = 7.17GKK3 pKa = 10.26AYY5 pKa = 10.28RR6 pKa = 11.84KK7 pKa = 9.97KK8 pKa = 10.87LGVNKK13 pKa = 10.13AATPAGGKK21 pKa = 10.19GKK23 pKa = 10.49GAGGGNAKK31 pKa = 10.23RR32 pKa = 11.84SGGAAGAGGAGPGGGAKK49 pKa = 10.22GAGGAGWGGASTFSATYY66 pKa = 10.04HH67 pKa = 5.68STFQTAVNVTNEE79 pKa = 4.49YY80 pKa = 9.74YY81 pKa = 10.53NQWGNDD87 pKa = 3.44CSSDD91 pKa = 4.14DD92 pKa = 4.92DD93 pKa = 4.9GPPSAPADD101 pKa = 3.64DD102 pKa = 4.42STFEE106 pKa = 4.09TAVNDD111 pKa = 3.7TNEE114 pKa = 4.12YY115 pKa = 8.71YY116 pKa = 10.09QEE118 pKa = 4.49EE119 pKa = 4.32EE120 pKa = 4.83DD121 pKa = 4.48NNCSSPFAPADD132 pKa = 3.21HH133 pKa = 6.51STFEE137 pKa = 4.2TAVKK141 pKa = 10.2IMNEE145 pKa = 4.09HH146 pKa = 6.47YY147 pKa = 10.99DD148 pKa = 3.57DD149 pKa = 5.79DD150 pKa = 4.87EE151 pKa = 5.0NLGLSMDD158 pKa = 3.95SEE160 pKa = 4.72EE161 pKa = 5.36EE162 pKa = 4.38GVQDD166 pKa = 4.93AEE168 pKa = 4.44PVSDD172 pKa = 5.09ADD174 pKa = 5.29GEE176 pKa = 4.4GDD178 pKa = 4.18DD179 pKa = 5.42DD180 pKa = 5.36AGSGDD185 pKa = 4.1DD186 pKa = 5.13HH187 pKa = 8.31FGDD190 pKa = 4.96DD191 pKa = 5.5DD192 pKa = 5.48YY193 pKa = 11.97YY194 pKa = 11.61DD195 pKa = 5.53DD196 pKa = 6.76DD197 pKa = 4.42IAGCFDD203 pKa = 3.62AFYY206 pKa = 10.92DD207 pKa = 4.59PGDD210 pKa = 4.28AGDD213 pKa = 5.56GADD216 pKa = 4.3DD217 pKa = 3.21WWW219 pKa = 5.75
MM1 pKa = 7.17GKK3 pKa = 10.26AYY5 pKa = 10.28RR6 pKa = 11.84KK7 pKa = 9.97KK8 pKa = 10.87LGVNKK13 pKa = 10.13AATPAGGKK21 pKa = 10.19GKK23 pKa = 10.49GAGGGNAKK31 pKa = 10.23RR32 pKa = 11.84SGGAAGAGGAGPGGGAKK49 pKa = 10.22GAGGAGWGGASTFSATYY66 pKa = 10.04HH67 pKa = 5.68STFQTAVNVTNEE79 pKa = 4.49YY80 pKa = 9.74YY81 pKa = 10.53NQWGNDD87 pKa = 3.44CSSDD91 pKa = 4.14DD92 pKa = 4.92DD93 pKa = 4.9GPPSAPADD101 pKa = 3.64DD102 pKa = 4.42STFEE106 pKa = 4.09TAVNDD111 pKa = 3.7TNEE114 pKa = 4.12YY115 pKa = 8.71YY116 pKa = 10.09QEE118 pKa = 4.49EE119 pKa = 4.32EE120 pKa = 4.83DD121 pKa = 4.48NNCSSPFAPADD132 pKa = 3.21HH133 pKa = 6.51STFEE137 pKa = 4.2TAVKK141 pKa = 10.2IMNEE145 pKa = 4.09HH146 pKa = 6.47YY147 pKa = 10.99DD148 pKa = 3.57DD149 pKa = 5.79DD150 pKa = 4.87EE151 pKa = 5.0NLGLSMDD158 pKa = 3.95SEE160 pKa = 4.72EE161 pKa = 5.36EE162 pKa = 4.38GVQDD166 pKa = 4.93AEE168 pKa = 4.44PVSDD172 pKa = 5.09ADD174 pKa = 5.29GEE176 pKa = 4.4GDD178 pKa = 4.18DD179 pKa = 5.42DD180 pKa = 5.36AGSGDD185 pKa = 4.1DD186 pKa = 5.13HH187 pKa = 8.31FGDD190 pKa = 4.96DD191 pKa = 5.5DD192 pKa = 5.48YY193 pKa = 11.97YY194 pKa = 11.61DD195 pKa = 5.53DD196 pKa = 6.76DD197 pKa = 4.42IAGCFDD203 pKa = 3.62AFYY206 pKa = 10.92DD207 pKa = 4.59PGDD210 pKa = 4.28AGDD213 pKa = 5.56GADD216 pKa = 4.3DD217 pKa = 3.21WWW219 pKa = 5.75
Molecular weight: 22.5 kDa
Isoelectric point according different methods:
Protein with the highest isoelectric point:
>tr|A0A453SWJ1|A0A453SWJ1_AEGTS Isoform of A0A453SWM0 Uncharacterized protein OS=Aegilops tauschii subsp. strangulata OX=200361 PE=4 SV=1
LL1 pKa = 7.33PGIPAQVPRR10 pKa = 11.84LPPGLRR16 pKa = 11.84RR17 pKa = 11.84RR18 pKa = 11.84LRR20 pKa = 11.84RR21 pKa = 11.84ALRR24 pKa = 11.84RR25 pKa = 11.84LHH27 pKa = 6.38PLPLGAAPRR36 pKa = 11.84AALRR40 pKa = 11.84PPPPRR45 pKa = 11.84PLL47 pKa = 4.47
LL1 pKa = 7.33PGIPAQVPRR10 pKa = 11.84LPPGLRR16 pKa = 11.84RR17 pKa = 11.84RR18 pKa = 11.84LRR20 pKa = 11.84RR21 pKa = 11.84ALRR24 pKa = 11.84RR25 pKa = 11.84LHH27 pKa = 6.38PLPLGAAPRR36 pKa = 11.84AALRR40 pKa = 11.84PPPPRR45 pKa = 11.84PLL47 pKa = 4.47
Molecular weight: 5.21 kDa
Isoelectric point according different methods:
Peptides (in silico digests for buttom-up proteomics)
Below you can find in silico digests of the whole proteome with Trypsin, Chymotrypsin, Trypsin+LysC, LysN, ArgC proteases suitable for different mass spec machines.| Try ESI |
 |
|---|
| ChTry ESI |
|
|---|
| ArgC ESI |
|
|---|
| LysN ESI |
|
|---|
| TryLysC ESI |
|
|---|
| Try MALDI |
|
|---|
| ChTry MALDI |
|
|---|
| ArgC MALDI |
|
|---|
| LysN MALDI |
|
|---|
| TryLysC MALDI |
|
|---|
| Try LTQ |
|
|---|
| ChTry LTQ |
|
|---|
| ArgC LTQ |
|
|---|
| LysN LTQ |
|
|---|
| TryLysC LTQ |
|
|---|
| Try MSlow |
|
|---|
| ChTry MSlow |
|
|---|
| ArgC MSlow |
|
|---|
| LysN MSlow |
|
|---|
| TryLysC MSlow |
|
|---|
| Try MShigh |
|
|---|
| ChTry MShigh |
|
|---|
| ArgC MShigh |
|
|---|
| LysN MShigh |
|
|---|
| TryLysC MShigh |
|
|---|
General Statistics
Number of major isoforms |
Number of additional isoforms |
Number of all proteins |
Number of amino acids |
Min. Seq. Length |
Max. Seq. Length |
Avg. Seq. Length |
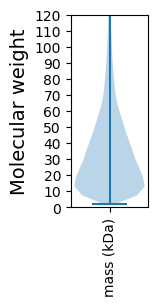
Avg. Mol. Weight |
|---|---|---|---|---|---|---|---|
72665765 |
21 |
5005 |
339.3 |
37.58 |
Amino acid frequency
Ala |
Cys |
Asp |
Glu |
Phe |
Gly |
His |
Ile |
Lys |
Leu |
|---|---|---|---|---|---|---|---|---|---|
8.232 ± 0.007 | 1.959 ± 0.003 |
5.404 ± 0.004 | 6.066 ± 0.006 |
3.8 ± 0.004 | 6.904 ± 0.006 |
2.557 ± 0.002 | 4.742 ± 0.004 |
5.25 ± 0.005 | 9.774 ± 0.007 |
Met |
Asn |
Gln |
Pro |
Arg |
Ser |
Thr |
Val |
Trp |
Tyr |
|---|---|---|---|---|---|---|---|---|---|
2.44 ± 0.003 | 3.698 ± 0.003 |
5.391 ± 0.006 | 3.685 ± 0.005 |
6.046 ± 0.005 | 8.437 ± 0.007 |
4.908 ± 0.003 | 6.703 ± 0.004 |
1.292 ± 0.002 | 2.705 ± 0.003 |
Most of the basic statistics you can see at this page can be downloaded from this CSV file
See this proteome in:

Proteome-pI is available under Creative Commons Attribution-NoDerivs license, for more details see here
| Reference: Kozlowski LP. Proteome-pI 2.0: Proteome Isoelectric Point Database Update. Nucleic Acids Res. 2021, doi: 10.1093/nar/gkab944 | Contact: Lukasz P. Kozlowski |