Enterobacteria phage M13 (Bacteriophage M13)
Taxonomy: Viruses; Monodnaviria; Loebvirae; Hofneiviricota; Faserviricetes; Tubulavirales; Inoviridae; Inovirus
Average proteome isoelectric point is 7.27
Get precalculated fractions of proteins
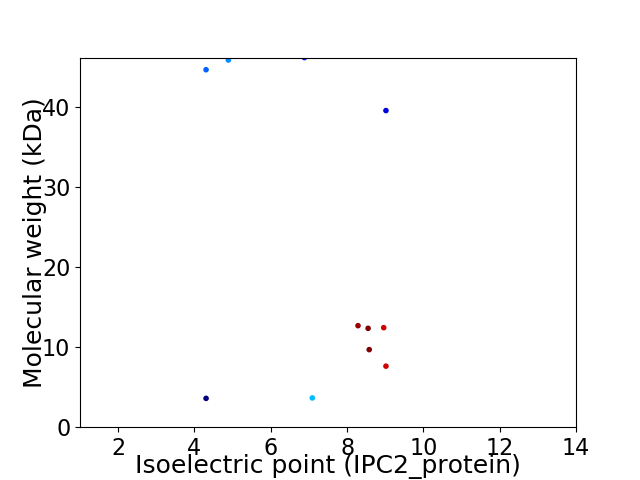
Virtual 2D-PAGE plot for 11 proteins (isoelectric point calculated using IPC2_protein)
Get csv file with sequences according to given criteria:
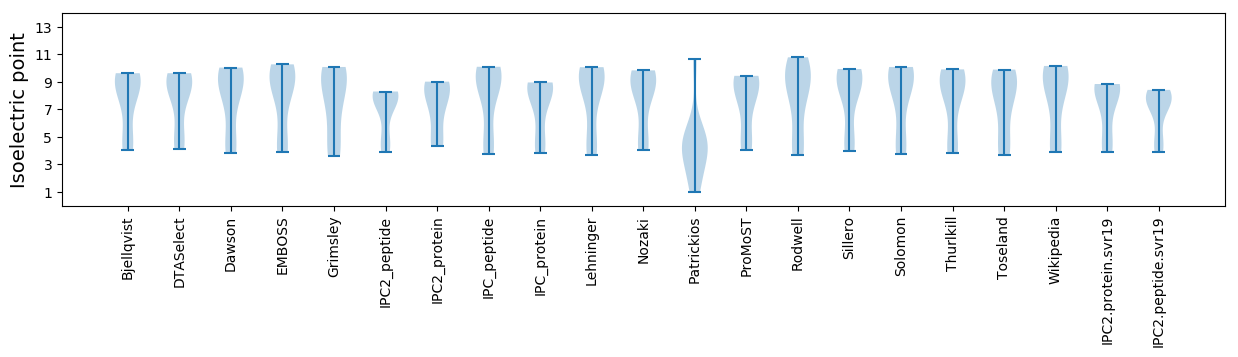
* You can choose from 21 different methods for calculating isoelectric point
Summary statistics related to proteome-wise predictions
Protein with the lowest isoelectric point:
>sp|P69538|G9P_BPM13 Tail virion protein G9P OS=Enterobacteria phage M13 OX=1977402 GN=IX PE=1 SV=1
MM1 pKa = 7.07EE2 pKa = 4.16QVADD6 pKa = 4.42FDD8 pKa = 4.64TIYY11 pKa = 10.92QAMIQISVVLCFALGIIAGGQRR33 pKa = 3.18
MM1 pKa = 7.07EE2 pKa = 4.16QVADD6 pKa = 4.42FDD8 pKa = 4.64TIYY11 pKa = 10.92QAMIQISVVLCFALGIIAGGQRR33 pKa = 3.18
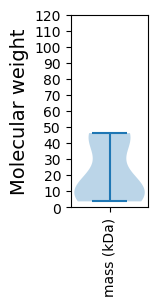
Molecular weight: 3.6 kDa
Isoelectric point according different methods:
Protein with the highest isoelectric point:
>sp|P69547-2|REP-2_BPM13 Isoform of P69547 Isoform G10P of Replication-associated protein G2P OS=Enterobacteria phage M13 OX=1977402 GN=II PE=4 SV=1
MM1 pKa = 7.78KK2 pKa = 9.28LTKK5 pKa = 9.8IYY7 pKa = 10.28LKK9 pKa = 10.39KK10 pKa = 10.56FSRR13 pKa = 11.84VLCLAIGFASAFTYY27 pKa = 10.44SYY29 pKa = 9.01ITQPKK34 pKa = 8.51PEE36 pKa = 4.15VKK38 pKa = 10.17KK39 pKa = 11.04VVSQTYY45 pKa = 10.61DD46 pKa = 3.05FDD48 pKa = 4.36KK49 pKa = 10.7FTIDD53 pKa = 3.03SSQRR57 pKa = 11.84LNLSYY62 pKa = 10.63RR63 pKa = 11.84YY64 pKa = 9.78VFKK67 pKa = 10.71DD68 pKa = 3.41SKK70 pKa = 11.38GKK72 pKa = 10.47LINSDD77 pKa = 4.1DD78 pKa = 4.08LQKK81 pKa = 10.71QGYY84 pKa = 8.1SLTYY88 pKa = 9.83IDD90 pKa = 5.34LCTVSIKK97 pKa = 10.46KK98 pKa = 10.48GNSNEE103 pKa = 3.96IVKK106 pKa = 10.79CNN108 pKa = 3.35
MM1 pKa = 7.78KK2 pKa = 9.28LTKK5 pKa = 9.8IYY7 pKa = 10.28LKK9 pKa = 10.39KK10 pKa = 10.56FSRR13 pKa = 11.84VLCLAIGFASAFTYY27 pKa = 10.44SYY29 pKa = 9.01ITQPKK34 pKa = 8.51PEE36 pKa = 4.15VKK38 pKa = 10.17KK39 pKa = 11.04VVSQTYY45 pKa = 10.61DD46 pKa = 3.05FDD48 pKa = 4.36KK49 pKa = 10.7FTIDD53 pKa = 3.03SSQRR57 pKa = 11.84LNLSYY62 pKa = 10.63RR63 pKa = 11.84YY64 pKa = 9.78VFKK67 pKa = 10.71DD68 pKa = 3.41SKK70 pKa = 11.38GKK72 pKa = 10.47LINSDD77 pKa = 4.1DD78 pKa = 4.08LQKK81 pKa = 10.71QGYY84 pKa = 8.1SLTYY88 pKa = 9.83IDD90 pKa = 5.34LCTVSIKK97 pKa = 10.46KK98 pKa = 10.48GNSNEE103 pKa = 3.96IVKK106 pKa = 10.79CNN108 pKa = 3.35
Molecular weight: 12.43 kDa
Isoelectric point according different methods:
Peptides (in silico digests for buttom-up proteomics)
Below you can find in silico digests of the whole proteome with Trypsin, Chymotrypsin, Trypsin+LysC, LysN, ArgC proteases suitable for different mass spec machines.| Try ESI |
 |
|---|
| ChTry ESI |
|
|---|
| ArgC ESI |
|
|---|
| LysN ESI |
|
|---|
| TryLysC ESI |
|
|---|
| Try MALDI |
|
|---|
| ChTry MALDI |
|
|---|
| ArgC MALDI |
|
|---|
| LysN MALDI |
|
|---|
| TryLysC MALDI |
|
|---|
| Try LTQ |
|
|---|
| ChTry LTQ |
|
|---|
| ArgC LTQ |
|
|---|
| LysN LTQ |
|
|---|
| TryLysC LTQ |
|
|---|
| Try MSlow |
|
|---|
| ChTry MSlow |
|
|---|
| ArgC MSlow |
|
|---|
| LysN MSlow |
|
|---|
| TryLysC MSlow |
|
|---|
| Try MShigh |
|
|---|
| ChTry MShigh |
|
|---|
| ArgC MShigh |
|
|---|
| LysN MShigh |
|
|---|
| TryLysC MShigh |
|
|---|
General Statistics
Number of major isoforms |
Number of additional isoforms |
Number of all proteins |
Number of amino acids |
Min. Seq. Length |
Max. Seq. Length |
Avg. Seq. Length |
Avg. Mol. Weight |
|---|---|---|---|---|---|---|---|
2164 |
32 |
426 |
196.7 |
21.66 |
Amino acid frequency
Ala |
Cys |
Asp |
Glu |
Phe |
Gly |
His |
Ile |
Lys |
Leu |
|---|---|---|---|---|---|---|---|---|---|
6.007 ± 0.855 | 1.34 ± 0.308 |
5.638 ± 0.34 | 3.466 ± 0.589 |
5.545 ± 0.327 | 7.81 ± 1.67 |
0.878 ± 0.304 | 5.684 ± 0.669 |
5.915 ± 0.975 | 9.889 ± 0.99 |
Met |
Asn |
Gln |
Pro |
Arg |
Ser |
Thr |
Val |
Trp |
Tyr |
|---|---|---|---|---|---|---|---|---|---|
1.756 ± 0.275 | 5.591 ± 0.675 |
4.344 ± 0.429 | 3.974 ± 0.36 |
3.651 ± 0.502 | 10.166 ± 0.825 |
5.545 ± 0.249 | 7.625 ± 0.776 |
0.924 ± 0.198 | 4.251 ± 0.672 |
Most of the basic statistics you can see at this page can be downloaded from this CSV file
See this proteome in:

Proteome-pI is available under Creative Commons Attribution-NoDerivs license, for more details see here
| Reference: Kozlowski LP. Proteome-pI 2.0: Proteome Isoelectric Point Database Update. Nucleic Acids Res. 2021, doi: 10.1093/nar/gkab944 | Contact: Lukasz P. Kozlowski |