Lactococcus phage 5205F
Taxonomy: Viruses; Duplodnaviria; Heunggongvirae; Uroviricota; Caudoviricetes; Caudovirales; Siphoviridae; Ceduovirus; unclassified Ceduovirus
Average proteome isoelectric point is 6.2
Get precalculated fractions of proteins
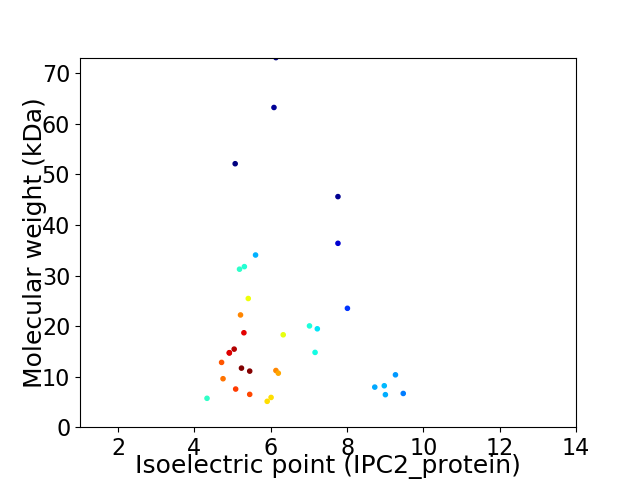
Virtual 2D-PAGE plot for 35 proteins (isoelectric point calculated using IPC2_protein)
Get csv file with sequences according to given criteria:
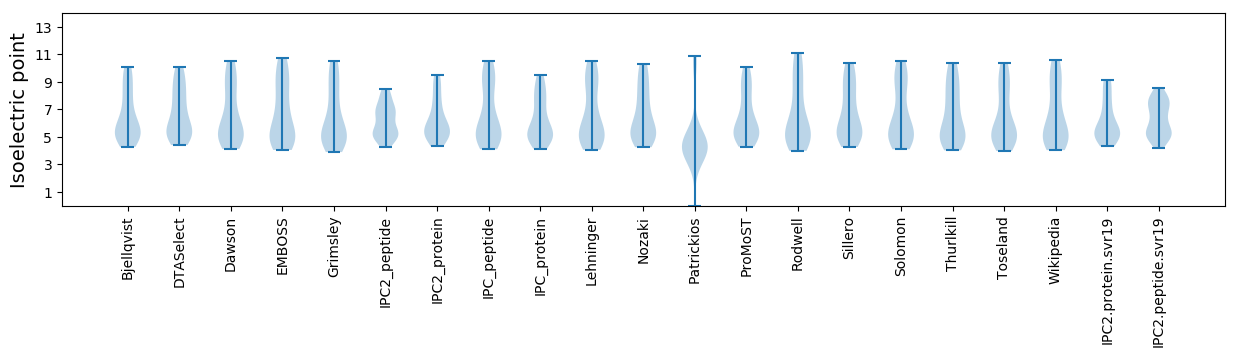
* You can choose from 21 different methods for calculating isoelectric point
Summary statistics related to proteome-wise predictions
Protein with the lowest isoelectric point:
>tr|A0A650ER10|A0A650ER10_9CAUD Uncharacterized protein OS=Lactococcus phage 5205F OX=2675236 GN=5205F_000051 PE=4 SV=1
MM1 pKa = 7.66AEE3 pKa = 3.91KK4 pKa = 10.59NIYY7 pKa = 9.19FVNDD11 pKa = 3.28EE12 pKa = 4.44VEE14 pKa = 4.24LKK16 pKa = 10.42QVLEE20 pKa = 5.24FIDD23 pKa = 3.55KK24 pKa = 10.01TDD26 pKa = 3.39YY27 pKa = 11.08GVNIDD32 pKa = 3.61KK33 pKa = 10.05TRR35 pKa = 11.84EE36 pKa = 3.6DD37 pKa = 3.69VYY39 pKa = 11.64AVVTSYY45 pKa = 11.55SLPII49 pKa = 4.27
MM1 pKa = 7.66AEE3 pKa = 3.91KK4 pKa = 10.59NIYY7 pKa = 9.19FVNDD11 pKa = 3.28EE12 pKa = 4.44VEE14 pKa = 4.24LKK16 pKa = 10.42QVLEE20 pKa = 5.24FIDD23 pKa = 3.55KK24 pKa = 10.01TDD26 pKa = 3.39YY27 pKa = 11.08GVNIDD32 pKa = 3.61KK33 pKa = 10.05TRR35 pKa = 11.84EE36 pKa = 3.6DD37 pKa = 3.69VYY39 pKa = 11.64AVVTSYY45 pKa = 11.55SLPII49 pKa = 4.27
Molecular weight: 5.72 kDa
Isoelectric point according different methods:
Protein with the highest isoelectric point:
>tr|A0A650ER20|A0A650ER20_9CAUD Uncharacterized protein OS=Lactococcus phage 5205F OX=2675236 GN=5205F_000063 PE=4 SV=1
MM1 pKa = 7.41ATTNKK6 pKa = 8.11VTGLEE11 pKa = 4.14KK12 pKa = 10.14FTEE15 pKa = 4.18KK16 pKa = 10.32QLKK19 pKa = 9.46KK20 pKa = 10.55VWLEE24 pKa = 3.86MVDD27 pKa = 4.27SFNSNQNTVKK37 pKa = 10.51RR38 pKa = 11.84SYY40 pKa = 10.61KK41 pKa = 10.29SSLGGDD47 pKa = 4.01FSRR50 pKa = 11.84YY51 pKa = 8.21PVTRR55 pKa = 11.84NGRR58 pKa = 3.44
MM1 pKa = 7.41ATTNKK6 pKa = 8.11VTGLEE11 pKa = 4.14KK12 pKa = 10.14FTEE15 pKa = 4.18KK16 pKa = 10.32QLKK19 pKa = 9.46KK20 pKa = 10.55VWLEE24 pKa = 3.86MVDD27 pKa = 4.27SFNSNQNTVKK37 pKa = 10.51RR38 pKa = 11.84SYY40 pKa = 10.61KK41 pKa = 10.29SSLGGDD47 pKa = 4.01FSRR50 pKa = 11.84YY51 pKa = 8.21PVTRR55 pKa = 11.84NGRR58 pKa = 3.44
Molecular weight: 6.67 kDa
Isoelectric point according different methods:
Peptides (in silico digests for buttom-up proteomics)
Below you can find in silico digests of the whole proteome with Trypsin, Chymotrypsin, Trypsin+LysC, LysN, ArgC proteases suitable for different mass spec machines.| Try ESI |
 |
|---|
| ChTry ESI |
|
|---|
| ArgC ESI |
|
|---|
| LysN ESI |
|
|---|
| TryLysC ESI |
|
|---|
| Try MALDI |
|
|---|
| ChTry MALDI |
|
|---|
| ArgC MALDI |
|
|---|
| LysN MALDI |
|
|---|
| TryLysC MALDI |
|
|---|
| Try LTQ |
|
|---|
| ChTry LTQ |
|
|---|
| ArgC LTQ |
|
|---|
| LysN LTQ |
|
|---|
| TryLysC LTQ |
|
|---|
| Try MSlow |
|
|---|
| ChTry MSlow |
|
|---|
| ArgC MSlow |
|
|---|
| LysN MSlow |
|
|---|
| TryLysC MSlow |
|
|---|
| Try MShigh |
|
|---|
| ChTry MShigh |
|
|---|
| ArgC MShigh |
|
|---|
| LysN MShigh |
|
|---|
| TryLysC MShigh |
|
|---|
General Statistics
Number of major isoforms |
Number of additional isoforms |
Number of all proteins |
Number of amino acids |
Min. Seq. Length |
Max. Seq. Length |
Avg. Seq. Length |
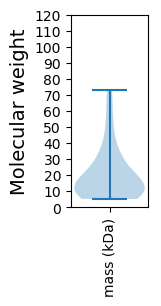
Avg. Mol. Weight |
|---|---|---|---|---|---|---|---|
0 |
6276 |
46 |
638 |
179.3 |
20.36 |
Amino acid frequency
Ala |
Cys |
Asp |
Glu |
Phe |
Gly |
His |
Ile |
Lys |
Leu |
|---|---|---|---|---|---|---|---|---|---|
6.326 ± 0.475 | 0.94 ± 0.199 |
6.103 ± 0.282 | 7.138 ± 0.539 |
4.557 ± 0.293 | 6.915 ± 0.49 |
1.179 ± 0.173 | 6.214 ± 0.415 |
8.907 ± 0.452 | 8.222 ± 0.476 |
Met |
Asn |
Gln |
Pro |
Arg |
Ser |
Thr |
Val |
Trp |
Tyr |
|---|---|---|---|---|---|---|---|---|---|
2.9 ± 0.254 | 6.676 ± 0.344 |
2.597 ± 0.33 | 4.079 ± 0.319 |
3.394 ± 0.276 | 5.577 ± 0.427 |
6.437 ± 0.489 | 5.959 ± 0.325 |
1.546 ± 0.192 | 4.334 ± 0.342 |
Most of the basic statistics you can see at this page can be downloaded from this CSV file
See this proteome in:

Proteome-pI is available under Creative Commons Attribution-NoDerivs license, for more details see here
| Reference: Kozlowski LP. Proteome-pI 2.0: Proteome Isoelectric Point Database Update. Nucleic Acids Res. 2021, doi: 10.1093/nar/gkab944 | Contact: Lukasz P. Kozlowski |