Enterococcus phage heks
Taxonomy: Viruses; Duplodnaviria; Heunggongvirae; Uroviricota; Caudoviricetes; Caudovirales; Siphoviridae; Efquatrovirus; unclassified Efquatrovirus
Average proteome isoelectric point is 5.94
Get precalculated fractions of proteins
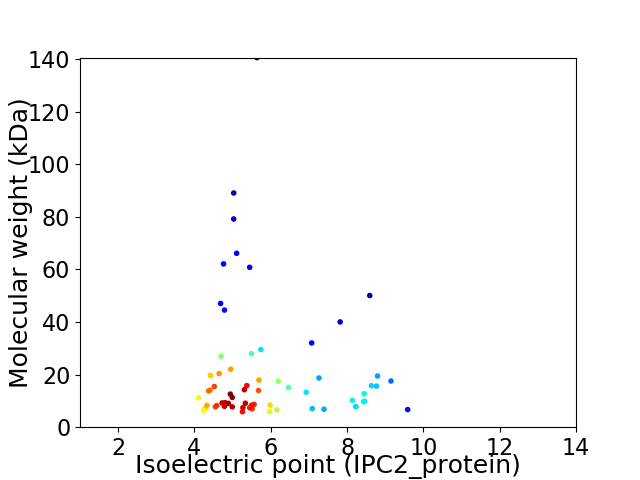
Virtual 2D-PAGE plot for 64 proteins (isoelectric point calculated using IPC2_protein)
Get csv file with sequences according to given criteria:
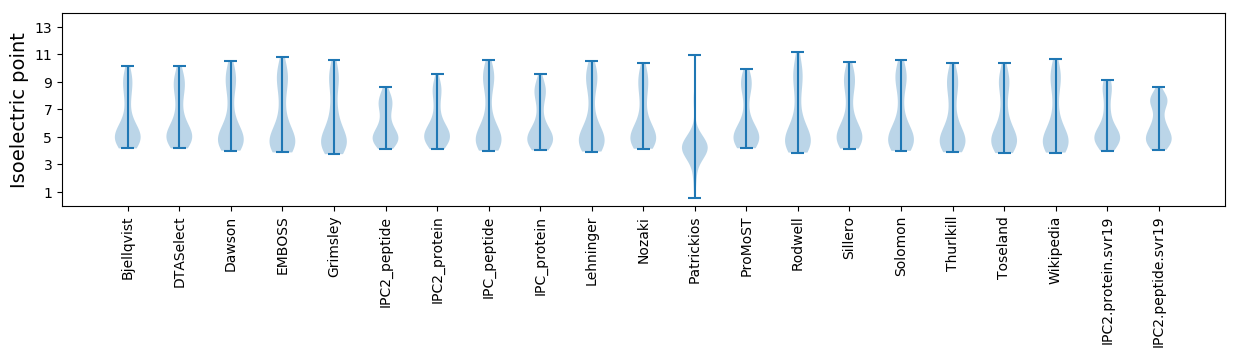
* You can choose from 21 different methods for calculating isoelectric point
Summary statistics related to proteome-wise predictions
Protein with the lowest isoelectric point:
>tr|A0A6G9LKK8|A0A6G9LKK8_9CAUD Uncharacterized protein OS=Enterococcus phage heks OX=2719592 GN=heks_60 PE=4 SV=1
MM1 pKa = 7.38YY2 pKa = 9.69IVNIIDD8 pKa = 3.68FEE10 pKa = 4.41ARR12 pKa = 11.84TLAYY16 pKa = 9.8QSEE19 pKa = 4.76VFTTKK24 pKa = 10.31EE25 pKa = 3.29LAEE28 pKa = 4.2NYY30 pKa = 9.28MEE32 pKa = 4.19EE33 pKa = 4.3VMEE36 pKa = 5.0NIHH39 pKa = 6.38GLDD42 pKa = 3.36VLIIEE47 pKa = 4.46VNSYY51 pKa = 10.57NLEE54 pKa = 3.87TAKK57 pKa = 10.33IVACSS62 pKa = 3.15
MM1 pKa = 7.38YY2 pKa = 9.69IVNIIDD8 pKa = 3.68FEE10 pKa = 4.41ARR12 pKa = 11.84TLAYY16 pKa = 9.8QSEE19 pKa = 4.76VFTTKK24 pKa = 10.31EE25 pKa = 3.29LAEE28 pKa = 4.2NYY30 pKa = 9.28MEE32 pKa = 4.19EE33 pKa = 4.3VMEE36 pKa = 5.0NIHH39 pKa = 6.38GLDD42 pKa = 3.36VLIIEE47 pKa = 4.46VNSYY51 pKa = 10.57NLEE54 pKa = 3.87TAKK57 pKa = 10.33IVACSS62 pKa = 3.15
Molecular weight: 7.13 kDa
Isoelectric point according different methods:
Protein with the highest isoelectric point:
>tr|A0A6G9LKT3|A0A6G9LKT3_9CAUD Head-tail joining protein OS=Enterococcus phage heks OX=2719592 GN=heks_25 PE=4 SV=1
MM1 pKa = 7.84PAPKK5 pKa = 9.78PIMVKK10 pKa = 10.03DD11 pKa = 3.87LRR13 pKa = 11.84TQQTRR18 pKa = 11.84VFKK21 pKa = 10.69SQSEE25 pKa = 3.86ADD27 pKa = 3.15RR28 pKa = 11.84FYY30 pKa = 11.36NKK32 pKa = 9.97KK33 pKa = 9.9SGYY36 pKa = 10.0FKK38 pKa = 10.66DD39 pKa = 3.7VKK41 pKa = 10.21TKK43 pKa = 10.55LGGKK47 pKa = 8.0NRR49 pKa = 11.84HH50 pKa = 5.09YY51 pKa = 10.77EE52 pKa = 4.06IIQVVV57 pKa = 3.15
MM1 pKa = 7.84PAPKK5 pKa = 9.78PIMVKK10 pKa = 10.03DD11 pKa = 3.87LRR13 pKa = 11.84TQQTRR18 pKa = 11.84VFKK21 pKa = 10.69SQSEE25 pKa = 3.86ADD27 pKa = 3.15RR28 pKa = 11.84FYY30 pKa = 11.36NKK32 pKa = 9.97KK33 pKa = 9.9SGYY36 pKa = 10.0FKK38 pKa = 10.66DD39 pKa = 3.7VKK41 pKa = 10.21TKK43 pKa = 10.55LGGKK47 pKa = 8.0NRR49 pKa = 11.84HH50 pKa = 5.09YY51 pKa = 10.77EE52 pKa = 4.06IIQVVV57 pKa = 3.15
Molecular weight: 6.7 kDa
Isoelectric point according different methods:
Peptides (in silico digests for buttom-up proteomics)
Below you can find in silico digests of the whole proteome with Trypsin, Chymotrypsin, Trypsin+LysC, LysN, ArgC proteases suitable for different mass spec machines.| Try ESI |
 |
|---|
| ChTry ESI |
|
|---|
| ArgC ESI |
|
|---|
| LysN ESI |
|
|---|
| TryLysC ESI |
|
|---|
| Try MALDI |
|
|---|
| ChTry MALDI |
|
|---|
| ArgC MALDI |
|
|---|
| LysN MALDI |
|
|---|
| TryLysC MALDI |
|
|---|
| Try LTQ |
|
|---|
| ChTry LTQ |
|
|---|
| ArgC LTQ |
|
|---|
| LysN LTQ |
|
|---|
| TryLysC LTQ |
|
|---|
| Try MSlow |
|
|---|
| ChTry MSlow |
|
|---|
| ArgC MSlow |
|
|---|
| LysN MSlow |
|
|---|
| TryLysC MSlow |
|
|---|
| Try MShigh |
|
|---|
| ChTry MShigh |
|
|---|
| ArgC MShigh |
|
|---|
| LysN MShigh |
|
|---|
| TryLysC MShigh |
|
|---|
General Statistics
Number of major isoforms |
Number of additional isoforms |
Number of all proteins |
Number of amino acids |
Min. Seq. Length |
Max. Seq. Length |
Avg. Seq. Length |
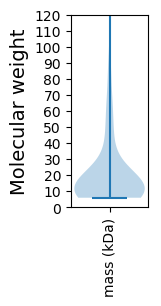
Avg. Mol. Weight |
|---|---|---|---|---|---|---|---|
0 |
11984 |
53 |
1295 |
187.3 |
21.35 |
Amino acid frequency
Ala |
Cys |
Asp |
Glu |
Phe |
Gly |
His |
Ile |
Lys |
Leu |
|---|---|---|---|---|---|---|---|---|---|
5.766 ± 0.497 | 0.801 ± 0.13 |
6.225 ± 0.286 | 8.344 ± 0.503 |
3.88 ± 0.252 | 6.317 ± 0.623 |
1.535 ± 0.182 | 6.676 ± 0.187 |
8.653 ± 0.364 | 8.57 ± 0.314 |
Met |
Asn |
Gln |
Pro |
Arg |
Ser |
Thr |
Val |
Trp |
Tyr |
|---|---|---|---|---|---|---|---|---|---|
2.996 ± 0.196 | 6.442 ± 0.28 |
2.854 ± 0.209 | 3.788 ± 0.225 |
3.688 ± 0.193 | 5.224 ± 0.229 |
6.066 ± 0.364 | 6.6 ± 0.277 |
1.318 ± 0.152 | 4.256 ± 0.339 |
Most of the basic statistics you can see at this page can be downloaded from this CSV file
See this proteome in:

Proteome-pI is available under Creative Commons Attribution-NoDerivs license, for more details see here
| Reference: Kozlowski LP. Proteome-pI 2.0: Proteome Isoelectric Point Database Update. Nucleic Acids Res. 2021, doi: 10.1093/nar/gkab944 | Contact: Lukasz P. Kozlowski |