Perca fluviatilis (European perch)
Taxonomy: cellular organisms; Eukaryota; Opisthokonta; Metazoa; Eumetazoa; Bilateria; Deuterostomia; Chordata; Craniata; Vertebrata; Gnathostomata; Teleostomi; Euteleostomi; Actinopterygii; Actinopteri; Neopterygii; Teleostei; Osteoglossocephalai; Clupeocephala; Euteleosteomorpha; Neoteleostei; Eurypterygia; Ctenosquamat
Average proteome isoelectric point is 6.55
Get precalculated fractions of proteins
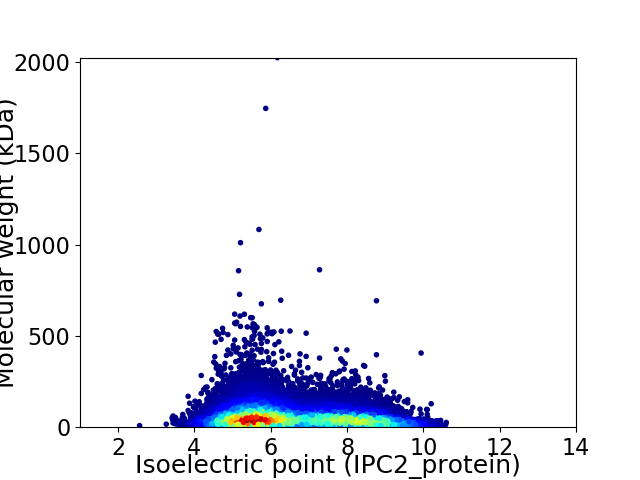
Virtual 2D-PAGE plot for 24123 proteins (isoelectric point calculated using IPC2_protein)
Get csv file with sequences according to given criteria:
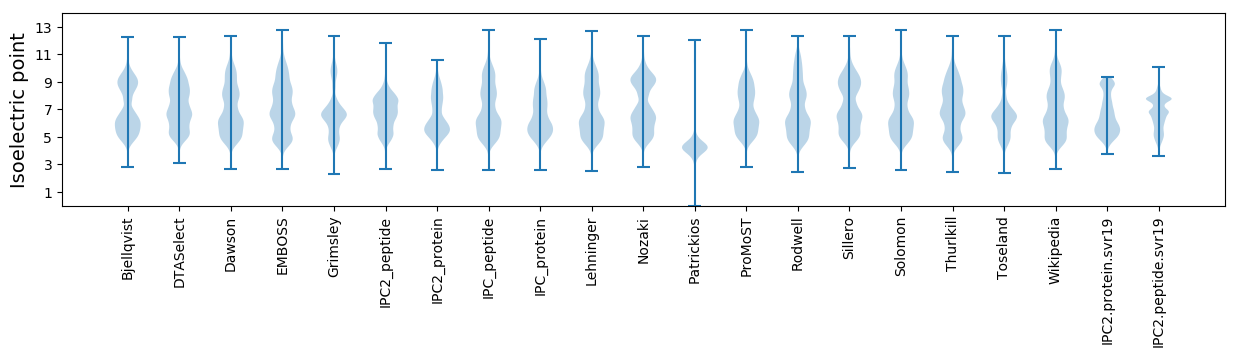
* You can choose from 21 different methods for calculating isoelectric point
Summary statistics related to proteome-wise predictions
Protein with the lowest isoelectric point:
>tr|A0A6A5EAC8|A0A6A5EAC8_PERFL Uncharacterized protein OS=Perca fluviatilis OX=8168 GN=PFLUV_G00225870 PE=4 SV=1
MM1 pKa = 7.68DD2 pKa = 4.33HH3 pKa = 7.14CEE5 pKa = 3.97EE6 pKa = 4.31LTAEE10 pKa = 4.02DD11 pKa = 4.95CMWVLCLSPSLSFLQLLTEE30 pKa = 4.5PQQGRR35 pKa = 11.84AAILSVGVACSTLLSDD51 pKa = 4.96PQQQQLALQLLDD63 pKa = 3.73SLVSRR68 pKa = 11.84GQGVLEE74 pKa = 3.99EE75 pKa = 5.72AILQDD80 pKa = 3.65SSSSLDD86 pKa = 2.99LWTSVASLCSEE97 pKa = 4.71LNRR100 pKa = 11.84ADD102 pKa = 3.98LSGG105 pKa = 3.3
MM1 pKa = 7.68DD2 pKa = 4.33HH3 pKa = 7.14CEE5 pKa = 3.97EE6 pKa = 4.31LTAEE10 pKa = 4.02DD11 pKa = 4.95CMWVLCLSPSLSFLQLLTEE30 pKa = 4.5PQQGRR35 pKa = 11.84AAILSVGVACSTLLSDD51 pKa = 4.96PQQQQLALQLLDD63 pKa = 3.73SLVSRR68 pKa = 11.84GQGVLEE74 pKa = 3.99EE75 pKa = 5.72AILQDD80 pKa = 3.65SSSSLDD86 pKa = 2.99LWTSVASLCSEE97 pKa = 4.71LNRR100 pKa = 11.84ADD102 pKa = 3.98LSGG105 pKa = 3.3
Molecular weight: 11.28 kDa
Isoelectric point according different methods:
Protein with the highest isoelectric point:
>tr|A0A6A5F2M2|A0A6A5F2M2_PERFL C-type lectin domain-containing protein OS=Perca fluviatilis OX=8168 GN=PFLUV_G00126750 PE=4 SV=1
LL1 pKa = 6.23WHH3 pKa = 5.75VTPPPLYY10 pKa = 10.28NPKK13 pKa = 9.9CQHH16 pKa = 5.99CPVYY20 pKa = 10.35RR21 pKa = 11.84PHH23 pKa = 7.77GDD25 pKa = 3.01VRR27 pKa = 11.84TCRR30 pKa = 11.84YY31 pKa = 9.06EE32 pKa = 4.15STQSRR37 pKa = 11.84HH38 pKa = 4.75NTRR41 pKa = 11.84KK42 pKa = 9.89SPMPKK47 pKa = 8.98RR48 pKa = 11.84RR49 pKa = 11.84RR50 pKa = 11.84VAPLNRR56 pKa = 11.84RR57 pKa = 11.84FLGGVCVPRR66 pKa = 11.84EE67 pKa = 4.05SEE69 pKa = 3.96RR70 pKa = 11.84EE71 pKa = 3.68RR72 pKa = 11.84EE73 pKa = 4.0RR74 pKa = 11.84EE75 pKa = 3.79KK76 pKa = 10.53EE77 pKa = 3.78RR78 pKa = 11.84EE79 pKa = 3.94RR80 pKa = 11.84EE81 pKa = 3.89RR82 pKa = 11.84EE83 pKa = 3.79RR84 pKa = 11.84GRR86 pKa = 11.84GRR88 pKa = 11.84ALINNNSAFRR98 pKa = 11.84SRR100 pKa = 11.84FYY102 pKa = 10.46WIQLFTASSVKK113 pKa = 9.92KK114 pKa = 10.2RR115 pKa = 11.84LRR117 pKa = 11.84GLCLCYY123 pKa = 10.17FFPNILSPVVHH134 pKa = 5.97TFIVEE139 pKa = 3.9CHH141 pKa = 6.38CGSEE145 pKa = 3.99KK146 pKa = 10.74LFRR149 pKa = 11.84HH150 pKa = 5.95DD151 pKa = 5.85AEE153 pKa = 5.75LGLCGHH159 pKa = 7.69LAANPEE165 pKa = 4.26KK166 pKa = 10.78APSRR170 pKa = 11.84DD171 pKa = 3.28VRR173 pKa = 11.84SFRR176 pKa = 11.84YY177 pKa = 9.26PRR179 pKa = 11.84AHH181 pKa = 6.89PAQRR185 pKa = 11.84AAPAAGSGWAVV196 pKa = 2.94
LL1 pKa = 6.23WHH3 pKa = 5.75VTPPPLYY10 pKa = 10.28NPKK13 pKa = 9.9CQHH16 pKa = 5.99CPVYY20 pKa = 10.35RR21 pKa = 11.84PHH23 pKa = 7.77GDD25 pKa = 3.01VRR27 pKa = 11.84TCRR30 pKa = 11.84YY31 pKa = 9.06EE32 pKa = 4.15STQSRR37 pKa = 11.84HH38 pKa = 4.75NTRR41 pKa = 11.84KK42 pKa = 9.89SPMPKK47 pKa = 8.98RR48 pKa = 11.84RR49 pKa = 11.84RR50 pKa = 11.84VAPLNRR56 pKa = 11.84RR57 pKa = 11.84FLGGVCVPRR66 pKa = 11.84EE67 pKa = 4.05SEE69 pKa = 3.96RR70 pKa = 11.84EE71 pKa = 3.68RR72 pKa = 11.84EE73 pKa = 4.0RR74 pKa = 11.84EE75 pKa = 3.79KK76 pKa = 10.53EE77 pKa = 3.78RR78 pKa = 11.84EE79 pKa = 3.94RR80 pKa = 11.84EE81 pKa = 3.89RR82 pKa = 11.84EE83 pKa = 3.79RR84 pKa = 11.84GRR86 pKa = 11.84GRR88 pKa = 11.84ALINNNSAFRR98 pKa = 11.84SRR100 pKa = 11.84FYY102 pKa = 10.46WIQLFTASSVKK113 pKa = 9.92KK114 pKa = 10.2RR115 pKa = 11.84LRR117 pKa = 11.84GLCLCYY123 pKa = 10.17FFPNILSPVVHH134 pKa = 5.97TFIVEE139 pKa = 3.9CHH141 pKa = 6.38CGSEE145 pKa = 3.99KK146 pKa = 10.74LFRR149 pKa = 11.84HH150 pKa = 5.95DD151 pKa = 5.85AEE153 pKa = 5.75LGLCGHH159 pKa = 7.69LAANPEE165 pKa = 4.26KK166 pKa = 10.78APSRR170 pKa = 11.84DD171 pKa = 3.28VRR173 pKa = 11.84SFRR176 pKa = 11.84YY177 pKa = 9.26PRR179 pKa = 11.84AHH181 pKa = 6.89PAQRR185 pKa = 11.84AAPAAGSGWAVV196 pKa = 2.94
Molecular weight: 22.77 kDa
Isoelectric point according different methods:
Peptides (in silico digests for buttom-up proteomics)
Below you can find in silico digests of the whole proteome with Trypsin, Chymotrypsin, Trypsin+LysC, LysN, ArgC proteases suitable for different mass spec machines.| Try ESI |
 |
|---|
| ChTry ESI |
|
|---|
| ArgC ESI |
|
|---|
| LysN ESI |
|
|---|
| TryLysC ESI |
|
|---|
| Try MALDI |
|
|---|
| ChTry MALDI |
|
|---|
| ArgC MALDI |
|
|---|
| LysN MALDI |
|
|---|
| TryLysC MALDI |
|
|---|
| Try LTQ |
|
|---|
| ChTry LTQ |
|
|---|
| ArgC LTQ |
|
|---|
| LysN LTQ |
|
|---|
| TryLysC LTQ |
|
|---|
| Try MSlow |
|
|---|
| ChTry MSlow |
|
|---|
| ArgC MSlow |
|
|---|
| LysN MSlow |
|
|---|
| TryLysC MSlow |
|
|---|
| Try MShigh |
|
|---|
| ChTry MShigh |
|
|---|
| ArgC MShigh |
|
|---|
| LysN MShigh |
|
|---|
| TryLysC MShigh |
|
|---|
General Statistics
Number of major isoforms |
Number of additional isoforms |
Number of all proteins |
Number of amino acids |
Min. Seq. Length |
Max. Seq. Length |
Avg. Seq. Length |
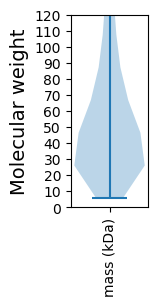
Avg. Mol. Weight |
|---|---|---|---|---|---|---|---|
0 |
13420900 |
51 |
18291 |
556.4 |
61.97 |
Amino acid frequency
Ala |
Cys |
Asp |
Glu |
Phe |
Gly |
His |
Ile |
Lys |
Leu |
|---|---|---|---|---|---|---|---|---|---|
6.665 ± 0.014 | 2.23 ± 0.013 |
5.228 ± 0.013 | 6.924 ± 0.024 |
3.467 ± 0.011 | 6.449 ± 0.022 |
2.629 ± 0.008 | 4.235 ± 0.013 |
5.572 ± 0.018 | 9.433 ± 0.023 |
Met |
Asn |
Gln |
Pro |
Arg |
Ser |
Thr |
Val |
Trp |
Tyr |
|---|---|---|---|---|---|---|---|---|---|
2.375 ± 0.008 | 3.801 ± 0.011 |
5.83 ± 0.021 | 4.797 ± 0.017 |
5.69 ± 0.016 | 8.817 ± 0.018 |
5.731 ± 0.015 | 6.319 ± 0.015 |
1.146 ± 0.005 | 2.662 ± 0.01 |
Most of the basic statistics you can see at this page can be downloaded from this CSV file
See this proteome in:

Proteome-pI is available under Creative Commons Attribution-NoDerivs license, for more details see here
| Reference: Kozlowski LP. Proteome-pI 2.0: Proteome Isoelectric Point Database Update. Nucleic Acids Res. 2021, doi: 10.1093/nar/gkab944 | Contact: Lukasz P. Kozlowski |