Escherichia phage Evi
Taxonomy: Viruses; Duplodnaviria; Heunggongvirae; Uroviricota; Caudoviricetes; Caudovirales; Siphoviridae; unclassified Siphoviridae
Average proteome isoelectric point is 6.9
Get precalculated fractions of proteins
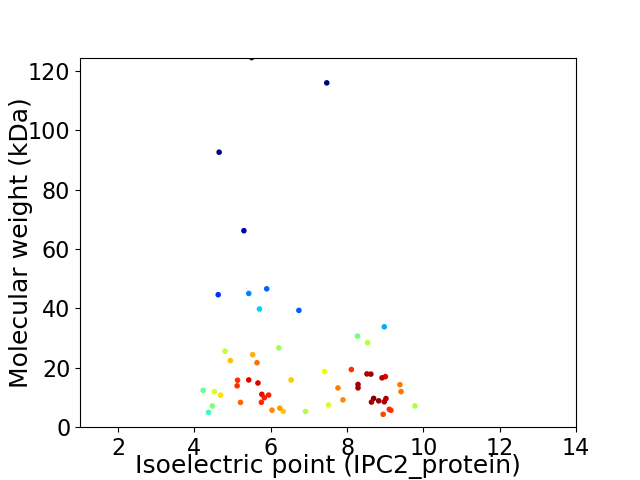
Virtual 2D-PAGE plot for 58 proteins (isoelectric point calculated using IPC2_protein)
Get csv file with sequences according to given criteria:
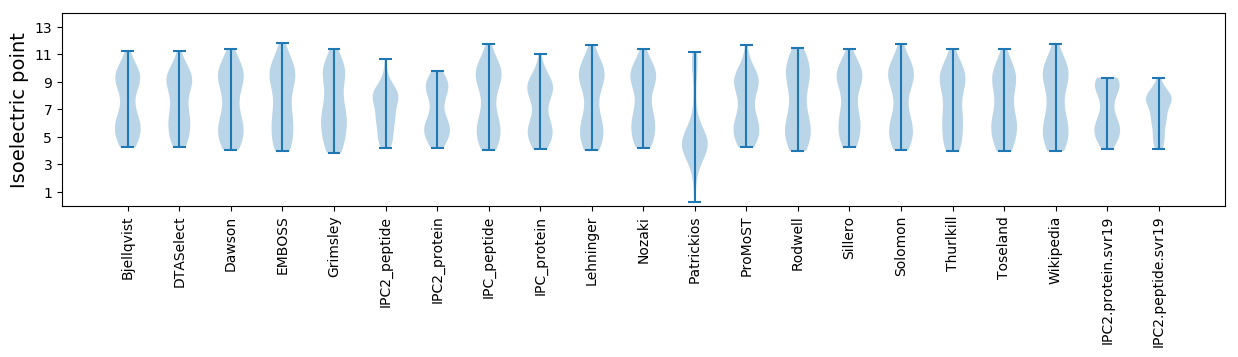
* You can choose from 21 different methods for calculating isoelectric point
Summary statistics related to proteome-wise predictions
Protein with the lowest isoelectric point:
>tr|A0A653FX14|A0A653FX14_9CAUD Primosomal protein I OS=Escherichia phage Evi OX=2562642 PE=4 SV=1
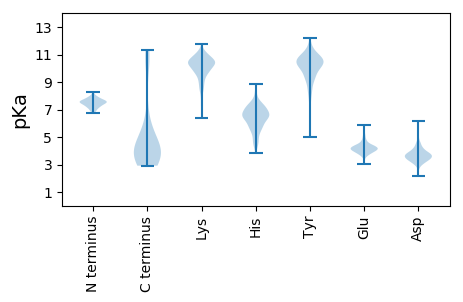
MM1 pKa = 7.58PEE3 pKa = 4.75EE4 pKa = 4.09YY5 pKa = 10.19VQPYY9 pKa = 9.57SVLVEE14 pKa = 4.04CHH16 pKa = 6.36ALQDD20 pKa = 3.98AAPDD24 pKa = 4.09AEE26 pKa = 4.16PHH28 pKa = 4.95QAEE31 pKa = 4.31VLIVHH36 pKa = 6.55FVPAALAQASS46 pKa = 3.68
MM1 pKa = 7.58PEE3 pKa = 4.75EE4 pKa = 4.09YY5 pKa = 10.19VQPYY9 pKa = 9.57SVLVEE14 pKa = 4.04CHH16 pKa = 6.36ALQDD20 pKa = 3.98AAPDD24 pKa = 4.09AEE26 pKa = 4.16PHH28 pKa = 4.95QAEE31 pKa = 4.31VLIVHH36 pKa = 6.55FVPAALAQASS46 pKa = 3.68
Molecular weight: 4.99 kDa
Isoelectric point according different methods:
Protein with the highest isoelectric point:
>tr|A0A653FU31|A0A653FU31_9CAUD Phage head maturation protease OS=Escherichia phage Evi OX=2562642 PE=4 SV=1
MM1 pKa = 6.78QAGRR5 pKa = 11.84LRR7 pKa = 11.84DD8 pKa = 3.35RR9 pKa = 11.84VIILNVTTARR19 pKa = 11.84SPSGHH24 pKa = 6.33PVEE27 pKa = 4.87TVTEE31 pKa = 4.65GATVWAEE38 pKa = 3.78VKK40 pKa = 10.5GISGRR45 pKa = 11.84EE46 pKa = 4.0IISGGAEE53 pKa = 3.65TAQATVRR60 pKa = 11.84VWMRR64 pKa = 11.84FRR66 pKa = 11.84RR67 pKa = 11.84DD68 pKa = 2.89VTATSRR74 pKa = 11.84LKK76 pKa = 11.07VLTGAFKK83 pKa = 10.84GAILGIEE90 pKa = 4.49GPPIPDD96 pKa = 3.01ARR98 pKa = 11.84ATRR101 pKa = 11.84LEE103 pKa = 4.16ILCSLKK109 pKa = 11.17GNVV112 pKa = 3.5
MM1 pKa = 6.78QAGRR5 pKa = 11.84LRR7 pKa = 11.84DD8 pKa = 3.35RR9 pKa = 11.84VIILNVTTARR19 pKa = 11.84SPSGHH24 pKa = 6.33PVEE27 pKa = 4.87TVTEE31 pKa = 4.65GATVWAEE38 pKa = 3.78VKK40 pKa = 10.5GISGRR45 pKa = 11.84EE46 pKa = 4.0IISGGAEE53 pKa = 3.65TAQATVRR60 pKa = 11.84VWMRR64 pKa = 11.84FRR66 pKa = 11.84RR67 pKa = 11.84DD68 pKa = 2.89VTATSRR74 pKa = 11.84LKK76 pKa = 11.07VLTGAFKK83 pKa = 10.84GAILGIEE90 pKa = 4.49GPPIPDD96 pKa = 3.01ARR98 pKa = 11.84ATRR101 pKa = 11.84LEE103 pKa = 4.16ILCSLKK109 pKa = 11.17GNVV112 pKa = 3.5
Molecular weight: 11.98 kDa
Isoelectric point according different methods:
Peptides (in silico digests for buttom-up proteomics)
Below you can find in silico digests of the whole proteome with Trypsin, Chymotrypsin, Trypsin+LysC, LysN, ArgC proteases suitable for different mass spec machines.| Try ESI |
 |
|---|
| ChTry ESI |
|
|---|
| ArgC ESI |
|
|---|
| LysN ESI |
|
|---|
| TryLysC ESI |
|
|---|
| Try MALDI |
|
|---|
| ChTry MALDI |
|
|---|
| ArgC MALDI |
|
|---|
| LysN MALDI |
|
|---|
| TryLysC MALDI |
|
|---|
| Try LTQ |
|
|---|
| ChTry LTQ |
|
|---|
| ArgC LTQ |
|
|---|
| LysN LTQ |
|
|---|
| TryLysC LTQ |
|
|---|
| Try MSlow |
|
|---|
| ChTry MSlow |
|
|---|
| ArgC MSlow |
|
|---|
| LysN MSlow |
|
|---|
| TryLysC MSlow |
|
|---|
| Try MShigh |
|
|---|
| ChTry MShigh |
|
|---|
| ArgC MShigh |
|
|---|
| LysN MShigh |
|
|---|
| TryLysC MShigh |
|
|---|
General Statistics
Number of major isoforms |
Number of additional isoforms |
Number of all proteins |
Number of amino acids |
Min. Seq. Length |
Max. Seq. Length |
Avg. Seq. Length |
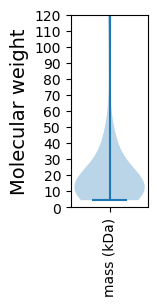
Avg. Mol. Weight |
|---|---|---|---|---|---|---|---|
0 |
11560 |
40 |
1137 |
199.3 |
22.12 |
Amino acid frequency
Ala |
Cys |
Asp |
Glu |
Phe |
Gly |
His |
Ile |
Lys |
Leu |
|---|---|---|---|---|---|---|---|---|---|
10.0 ± 0.587 | 1.228 ± 0.189 |
5.545 ± 0.256 | 6.92 ± 0.355 |
3.14 ± 0.223 | 7.076 ± 0.408 |
1.799 ± 0.272 | 5.13 ± 0.284 |
5.355 ± 0.262 | 7.958 ± 0.374 |
Met |
Asn |
Gln |
Pro |
Arg |
Ser |
Thr |
Val |
Trp |
Tyr |
|---|---|---|---|---|---|---|---|---|---|
2.517 ± 0.146 | 4.239 ± 0.273 |
4.17 ± 0.414 | 4.619 ± 0.328 |
6.462 ± 0.298 | 6.445 ± 0.375 |
6.047 ± 0.356 | 6.912 ± 0.292 |
1.661 ± 0.127 | 2.777 ± 0.184 |
Most of the basic statistics you can see at this page can be downloaded from this CSV file
See this proteome in:

Proteome-pI is available under Creative Commons Attribution-NoDerivs license, for more details see here
| Reference: Kozlowski LP. Proteome-pI 2.0: Proteome Isoelectric Point Database Update. Nucleic Acids Res. 2021, doi: 10.1093/nar/gkab944 | Contact: Lukasz P. Kozlowski |