Paenibacillus tyrfis
Taxonomy: cellular organisms; Bacteria; Terrabacteria group; Firmicutes; Bacilli; Bacillales; Paenibacillaceae; Paenibacillus
Average proteome isoelectric point is 6.5
Get precalculated fractions of proteins
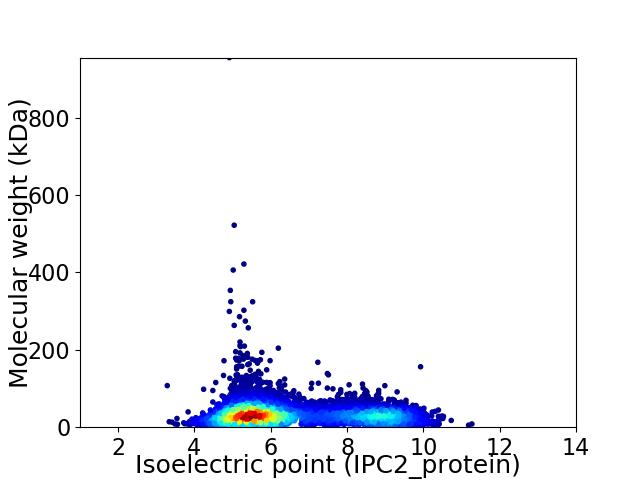
Virtual 2D-PAGE plot for 6455 proteins (isoelectric point calculated using IPC2_protein)
Get csv file with sequences according to given criteria:
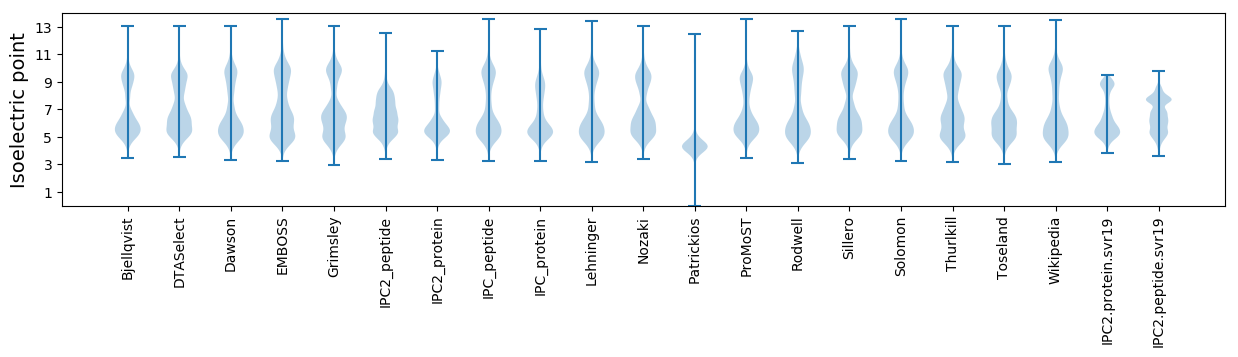
* You can choose from 21 different methods for calculating isoelectric point
Summary statistics related to proteome-wise predictions
Protein with the lowest isoelectric point:
>tr|A0A081NV69|A0A081NV69_9BACL Membrane protein OS=Paenibacillus tyrfis OX=1501230 GN=ET33_23475 PE=4 SV=1
MM1 pKa = 7.7PNKK4 pKa = 9.23FTEE7 pKa = 4.01TTYY10 pKa = 11.84ALNTCDD16 pKa = 4.22HH17 pKa = 6.85SSDD20 pKa = 3.32LLVYY24 pKa = 9.5FEE26 pKa = 5.62AIVMEE31 pKa = 4.37IQNGAAIKK39 pKa = 10.11DD40 pKa = 3.83YY41 pKa = 10.13QVCDD45 pKa = 3.59GSLVVTLQSDD55 pKa = 3.98DD56 pKa = 3.66VASS59 pKa = 3.57
MM1 pKa = 7.7PNKK4 pKa = 9.23FTEE7 pKa = 4.01TTYY10 pKa = 11.84ALNTCDD16 pKa = 4.22HH17 pKa = 6.85SSDD20 pKa = 3.32LLVYY24 pKa = 9.5FEE26 pKa = 5.62AIVMEE31 pKa = 4.37IQNGAAIKK39 pKa = 10.11DD40 pKa = 3.83YY41 pKa = 10.13QVCDD45 pKa = 3.59GSLVVTLQSDD55 pKa = 3.98DD56 pKa = 3.66VASS59 pKa = 3.57
Molecular weight: 6.48 kDa
Isoelectric point according different methods:
Protein with the highest isoelectric point:
>tr|A0A081P887|A0A081P887_9BACL Amidase_6 domain-containing protein OS=Paenibacillus tyrfis OX=1501230 GN=ET33_29680 PE=4 SV=1
MM1 pKa = 7.66LLHH4 pKa = 7.0LFRR7 pKa = 11.84FRR9 pKa = 11.84FRR11 pKa = 11.84LLWLRR16 pKa = 11.84WLRR19 pKa = 11.84WFPLRR24 pKa = 11.84WLRR27 pKa = 11.84LRR29 pKa = 11.84WLFPLLWLRR38 pKa = 11.84WFPLRR43 pKa = 11.84WFPLWVPLRR52 pKa = 11.84PVRR55 pKa = 11.84SVLLMFQQ62 pKa = 3.41
MM1 pKa = 7.66LLHH4 pKa = 7.0LFRR7 pKa = 11.84FRR9 pKa = 11.84FRR11 pKa = 11.84LLWLRR16 pKa = 11.84WLRR19 pKa = 11.84WFPLRR24 pKa = 11.84WLRR27 pKa = 11.84LRR29 pKa = 11.84WLFPLLWLRR38 pKa = 11.84WFPLRR43 pKa = 11.84WFPLWVPLRR52 pKa = 11.84PVRR55 pKa = 11.84SVLLMFQQ62 pKa = 3.41
Molecular weight: 8.39 kDa
Isoelectric point according different methods:
Peptides (in silico digests for buttom-up proteomics)
Below you can find in silico digests of the whole proteome with Trypsin, Chymotrypsin, Trypsin+LysC, LysN, ArgC proteases suitable for different mass spec machines.| Try ESI |
 |
|---|
| ChTry ESI |
|
|---|
| ArgC ESI |
|
|---|
| LysN ESI |
|
|---|
| TryLysC ESI |
|
|---|
| Try MALDI |
|
|---|
| ChTry MALDI |
|
|---|
| ArgC MALDI |
|
|---|
| LysN MALDI |
|
|---|
| TryLysC MALDI |
|
|---|
| Try LTQ |
|
|---|
| ChTry LTQ |
|
|---|
| ArgC LTQ |
|
|---|
| LysN LTQ |
|
|---|
| TryLysC LTQ |
|
|---|
| Try MSlow |
|
|---|
| ChTry MSlow |
|
|---|
| ArgC MSlow |
|
|---|
| LysN MSlow |
|
|---|
| TryLysC MSlow |
|
|---|
| Try MShigh |
|
|---|
| ChTry MShigh |
|
|---|
| ArgC MShigh |
|
|---|
| LysN MShigh |
|
|---|
| TryLysC MShigh |
|
|---|
General Statistics
Number of major isoforms |
Number of additional isoforms |
Number of all proteins |
Number of amino acids |
Min. Seq. Length |
Max. Seq. Length |
Avg. Seq. Length |
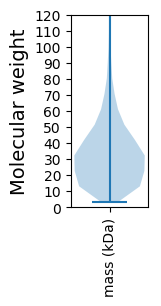
Avg. Mol. Weight |
|---|---|---|---|---|---|---|---|
0 |
2041611 |
33 |
8521 |
316.3 |
35.23 |
Amino acid frequency
Ala |
Cys |
Asp |
Glu |
Phe |
Gly |
His |
Ile |
Lys |
Leu |
|---|---|---|---|---|---|---|---|---|---|
8.715 ± 0.038 | 0.814 ± 0.01 |
5.009 ± 0.022 | 6.764 ± 0.033 |
4.139 ± 0.022 | 7.491 ± 0.028 |
2.111 ± 0.014 | 6.202 ± 0.028 |
5.369 ± 0.034 | 10.336 ± 0.046 |
Met |
Asn |
Gln |
Pro |
Arg |
Ser |
Thr |
Val |
Trp |
Tyr |
|---|---|---|---|---|---|---|---|---|---|
2.743 ± 0.013 | 3.451 ± 0.023 |
4.261 ± 0.02 | 3.883 ± 0.023 |
5.47 ± 0.029 | 5.987 ± 0.023 |
5.32 ± 0.023 | 7.225 ± 0.023 |
1.279 ± 0.012 | 3.433 ± 0.022 |
Most of the basic statistics you can see at this page can be downloaded from this CSV file
See this proteome in:

Proteome-pI is available under Creative Commons Attribution-NoDerivs license, for more details see here
| Reference: Kozlowski LP. Proteome-pI 2.0: Proteome Isoelectric Point Database Update. Nucleic Acids Res. 2021, doi: 10.1093/nar/gkab944 | Contact: Lukasz P. Kozlowski |