Capybara microvirus Cap1_SP_51
Taxonomy: Viruses; Monodnaviria; Sangervirae; Phixviricota; Malgrandaviricetes; Petitvirales; Microviridae; unclassified Microviridae
Average proteome isoelectric point is 5.94
Get precalculated fractions of proteins
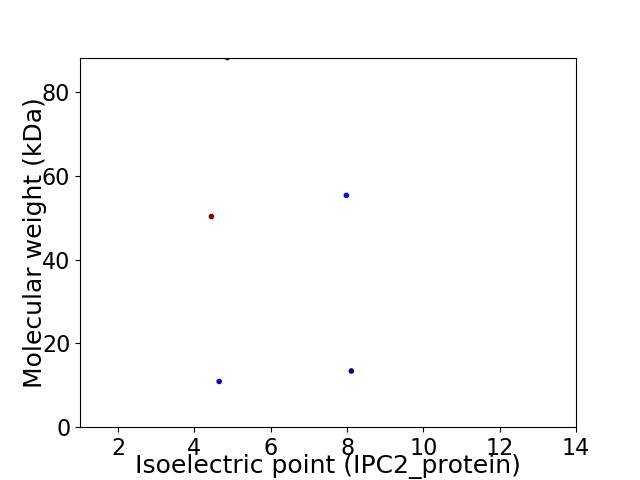
Virtual 2D-PAGE plot for 5 proteins (isoelectric point calculated using IPC2_protein)
Get csv file with sequences according to given criteria:
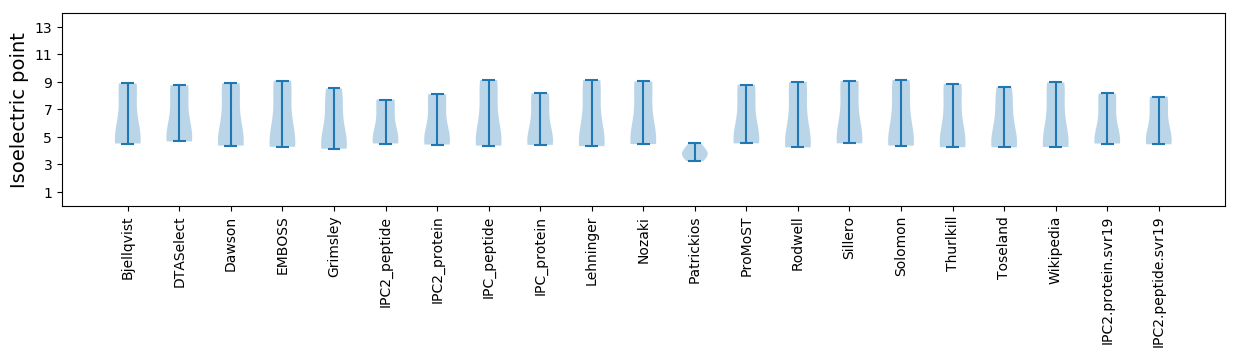
* You can choose from 21 different methods for calculating isoelectric point
Summary statistics related to proteome-wise predictions
Protein with the lowest isoelectric point:
>tr|A0A4P8W7G7|A0A4P8W7G7_9VIRU Uncharacterized protein OS=Capybara microvirus Cap1_SP_51 OX=2584781 PE=4 SV=1
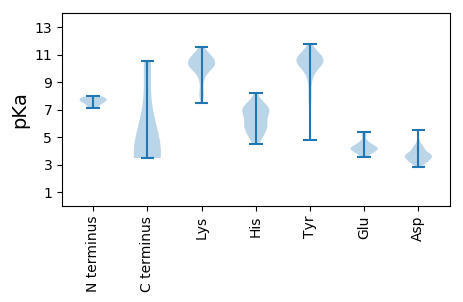
MM1 pKa = 7.69SSFLTRR7 pKa = 11.84LLNPIKK13 pKa = 10.52LPIISIPLSFIEE25 pKa = 5.13KK26 pKa = 10.4GVDD29 pKa = 3.33LFKK32 pKa = 11.07DD33 pKa = 3.51SSSLSEE39 pKa = 3.52ITIGSKK45 pKa = 10.28SLNDD49 pKa = 3.7TTLGSYY55 pKa = 10.51LGLTPSDD62 pKa = 3.46AAEE65 pKa = 4.19SAEE68 pKa = 4.03SSSFVIDD75 pKa = 3.73GVTFSADD82 pKa = 2.81NQYY85 pKa = 10.29AQNYY89 pKa = 6.98IARR92 pKa = 11.84FGYY95 pKa = 9.93SSPRR99 pKa = 11.84VLSSQLQKK107 pKa = 11.13SLWEE111 pKa = 3.78QAVSYY116 pKa = 7.94EE117 pKa = 4.01QNKK120 pKa = 10.13IITDD124 pKa = 3.47NQRR127 pKa = 11.84EE128 pKa = 4.08YY129 pKa = 11.18DD130 pKa = 3.89SEE132 pKa = 4.4SSQVEE137 pKa = 4.09RR138 pKa = 11.84LQEE141 pKa = 3.88AGINADD147 pKa = 3.5LSGLSGVSGISQSATSPSDD166 pKa = 3.19TDD168 pKa = 4.28DD169 pKa = 3.24VSNLINAGSGVVGLASGLFSGIFGGIQSIISIRR202 pKa = 11.84KK203 pKa = 8.13QLAEE207 pKa = 4.11TEE209 pKa = 4.28ATKK212 pKa = 11.09SNTFGGVVKK221 pKa = 10.44LAQEE225 pKa = 4.33RR226 pKa = 11.84ADD228 pKa = 3.67TMSGISITEE237 pKa = 4.06DD238 pKa = 2.98QDD240 pKa = 3.69GLKK243 pKa = 10.79FNGNLYY249 pKa = 9.89PDD251 pKa = 3.42WNSFYY256 pKa = 11.01DD257 pKa = 3.51ANTDD261 pKa = 3.79LFADD265 pKa = 4.27DD266 pKa = 5.54FSYY269 pKa = 10.88LPKK272 pKa = 10.25HH273 pKa = 5.6LQSVYY278 pKa = 10.37GKK280 pKa = 10.52AFFGRR285 pKa = 11.84FRR287 pKa = 11.84SAAGRR292 pKa = 11.84AAAARR297 pKa = 11.84NQLAANKK304 pKa = 9.24GASEE308 pKa = 5.14LIMDD312 pKa = 4.94QSFDD316 pKa = 3.78PANTSDD322 pKa = 4.13LFKK325 pKa = 10.2MAHH328 pKa = 4.46EE329 pKa = 4.51TFRR332 pKa = 11.84NSSSLSWLTTQIEE345 pKa = 4.26LQIKK349 pKa = 9.83QSLANSQIDD358 pKa = 3.52YY359 pKa = 9.77GGTMMTYY366 pKa = 11.09ADD368 pKa = 5.05LYY370 pKa = 11.43AMNEE374 pKa = 4.24TSSLQYY380 pKa = 10.85DD381 pKa = 3.87ITRR384 pKa = 11.84SLADD388 pKa = 3.42EE389 pKa = 3.82QVYY392 pKa = 10.5ILEE395 pKa = 4.49KK396 pKa = 10.21EE397 pKa = 3.92LRR399 pKa = 11.84LLVEE403 pKa = 4.0QDD405 pKa = 3.01EE406 pKa = 4.8AMTSRR411 pKa = 11.84IHH413 pKa = 7.06SSLINSINNDD423 pKa = 3.1FEE425 pKa = 4.65SPYY428 pKa = 10.09IRR430 pKa = 11.84SILLSALFSNPEE442 pKa = 3.74KK443 pKa = 10.61VASDD447 pKa = 3.39VVNNVITAAIGSALVLL463 pKa = 3.91
MM1 pKa = 7.69SSFLTRR7 pKa = 11.84LLNPIKK13 pKa = 10.52LPIISIPLSFIEE25 pKa = 5.13KK26 pKa = 10.4GVDD29 pKa = 3.33LFKK32 pKa = 11.07DD33 pKa = 3.51SSSLSEE39 pKa = 3.52ITIGSKK45 pKa = 10.28SLNDD49 pKa = 3.7TTLGSYY55 pKa = 10.51LGLTPSDD62 pKa = 3.46AAEE65 pKa = 4.19SAEE68 pKa = 4.03SSSFVIDD75 pKa = 3.73GVTFSADD82 pKa = 2.81NQYY85 pKa = 10.29AQNYY89 pKa = 6.98IARR92 pKa = 11.84FGYY95 pKa = 9.93SSPRR99 pKa = 11.84VLSSQLQKK107 pKa = 11.13SLWEE111 pKa = 3.78QAVSYY116 pKa = 7.94EE117 pKa = 4.01QNKK120 pKa = 10.13IITDD124 pKa = 3.47NQRR127 pKa = 11.84EE128 pKa = 4.08YY129 pKa = 11.18DD130 pKa = 3.89SEE132 pKa = 4.4SSQVEE137 pKa = 4.09RR138 pKa = 11.84LQEE141 pKa = 3.88AGINADD147 pKa = 3.5LSGLSGVSGISQSATSPSDD166 pKa = 3.19TDD168 pKa = 4.28DD169 pKa = 3.24VSNLINAGSGVVGLASGLFSGIFGGIQSIISIRR202 pKa = 11.84KK203 pKa = 8.13QLAEE207 pKa = 4.11TEE209 pKa = 4.28ATKK212 pKa = 11.09SNTFGGVVKK221 pKa = 10.44LAQEE225 pKa = 4.33RR226 pKa = 11.84ADD228 pKa = 3.67TMSGISITEE237 pKa = 4.06DD238 pKa = 2.98QDD240 pKa = 3.69GLKK243 pKa = 10.79FNGNLYY249 pKa = 9.89PDD251 pKa = 3.42WNSFYY256 pKa = 11.01DD257 pKa = 3.51ANTDD261 pKa = 3.79LFADD265 pKa = 4.27DD266 pKa = 5.54FSYY269 pKa = 10.88LPKK272 pKa = 10.25HH273 pKa = 5.6LQSVYY278 pKa = 10.37GKK280 pKa = 10.52AFFGRR285 pKa = 11.84FRR287 pKa = 11.84SAAGRR292 pKa = 11.84AAAARR297 pKa = 11.84NQLAANKK304 pKa = 9.24GASEE308 pKa = 5.14LIMDD312 pKa = 4.94QSFDD316 pKa = 3.78PANTSDD322 pKa = 4.13LFKK325 pKa = 10.2MAHH328 pKa = 4.46EE329 pKa = 4.51TFRR332 pKa = 11.84NSSSLSWLTTQIEE345 pKa = 4.26LQIKK349 pKa = 9.83QSLANSQIDD358 pKa = 3.52YY359 pKa = 9.77GGTMMTYY366 pKa = 11.09ADD368 pKa = 5.05LYY370 pKa = 11.43AMNEE374 pKa = 4.24TSSLQYY380 pKa = 10.85DD381 pKa = 3.87ITRR384 pKa = 11.84SLADD388 pKa = 3.42EE389 pKa = 3.82QVYY392 pKa = 10.5ILEE395 pKa = 4.49KK396 pKa = 10.21EE397 pKa = 3.92LRR399 pKa = 11.84LLVEE403 pKa = 4.0QDD405 pKa = 3.01EE406 pKa = 4.8AMTSRR411 pKa = 11.84IHH413 pKa = 7.06SSLINSINNDD423 pKa = 3.1FEE425 pKa = 4.65SPYY428 pKa = 10.09IRR430 pKa = 11.84SILLSALFSNPEE442 pKa = 3.74KK443 pKa = 10.61VASDD447 pKa = 3.39VVNNVITAAIGSALVLL463 pKa = 3.91
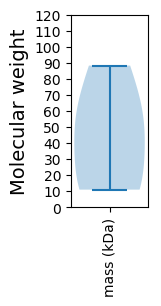
Molecular weight: 50.3 kDa
Isoelectric point according different methods:
Protein with the highest isoelectric point:
>tr|A0A4P8W4W2|A0A4P8W4W2_9VIRU Replication initiator protein OS=Capybara microvirus Cap1_SP_51 OX=2584781 PE=4 SV=1
MM1 pKa = 7.95SILNLFNFFSKK12 pKa = 10.52FKK14 pKa = 10.32PFLKK18 pKa = 9.95KK19 pKa = 10.56VYY21 pKa = 10.4SFTPLVLSVIAIFISLSCLRR41 pKa = 11.84VSRR44 pKa = 11.84SALEE48 pKa = 4.15KK49 pKa = 10.34SSHH52 pKa = 5.58AVEE55 pKa = 4.02ICSNYY60 pKa = 10.37SSDD63 pKa = 3.06ISSLVDD69 pKa = 3.24EE70 pKa = 4.49VRR72 pKa = 11.84KK73 pKa = 7.51MTEE76 pKa = 3.89TIEE79 pKa = 4.5NRR81 pKa = 11.84LDD83 pKa = 3.57EE84 pKa = 4.33QNEE87 pKa = 4.28MLSHH91 pKa = 7.07IYY93 pKa = 10.39GDD95 pKa = 4.01YY96 pKa = 10.67FISIYY101 pKa = 11.23GNGNKK106 pKa = 9.24VDD108 pKa = 3.79GKK110 pKa = 10.68NFGKK114 pKa = 9.3TSKK117 pKa = 10.58KK118 pKa = 10.52
MM1 pKa = 7.95SILNLFNFFSKK12 pKa = 10.52FKK14 pKa = 10.32PFLKK18 pKa = 9.95KK19 pKa = 10.56VYY21 pKa = 10.4SFTPLVLSVIAIFISLSCLRR41 pKa = 11.84VSRR44 pKa = 11.84SALEE48 pKa = 4.15KK49 pKa = 10.34SSHH52 pKa = 5.58AVEE55 pKa = 4.02ICSNYY60 pKa = 10.37SSDD63 pKa = 3.06ISSLVDD69 pKa = 3.24EE70 pKa = 4.49VRR72 pKa = 11.84KK73 pKa = 7.51MTEE76 pKa = 3.89TIEE79 pKa = 4.5NRR81 pKa = 11.84LDD83 pKa = 3.57EE84 pKa = 4.33QNEE87 pKa = 4.28MLSHH91 pKa = 7.07IYY93 pKa = 10.39GDD95 pKa = 4.01YY96 pKa = 10.67FISIYY101 pKa = 11.23GNGNKK106 pKa = 9.24VDD108 pKa = 3.79GKK110 pKa = 10.68NFGKK114 pKa = 9.3TSKK117 pKa = 10.58KK118 pKa = 10.52
Molecular weight: 13.42 kDa
Isoelectric point according different methods:
Peptides (in silico digests for buttom-up proteomics)
Below you can find in silico digests of the whole proteome with Trypsin, Chymotrypsin, Trypsin+LysC, LysN, ArgC proteases suitable for different mass spec machines.| Try ESI |
 |
|---|
| ChTry ESI |
|
|---|
| ArgC ESI |
|
|---|
| LysN ESI |
|
|---|
| TryLysC ESI |
|
|---|
| Try MALDI |
|
|---|
| ChTry MALDI |
|
|---|
| ArgC MALDI |
|
|---|
| LysN MALDI |
|
|---|
| TryLysC MALDI |
|
|---|
| Try LTQ |
|
|---|
| ChTry LTQ |
|
|---|
| ArgC LTQ |
|
|---|
| LysN LTQ |
|
|---|
| TryLysC LTQ |
|
|---|
| Try MSlow |
|
|---|
| ChTry MSlow |
|
|---|
| ArgC MSlow |
|
|---|
| LysN MSlow |
|
|---|
| TryLysC MSlow |
|
|---|
| Try MShigh |
|
|---|
| ChTry MShigh |
|
|---|
| ArgC MShigh |
|
|---|
| LysN MShigh |
|
|---|
| TryLysC MShigh |
|
|---|
General Statistics
Number of major isoforms |
Number of additional isoforms |
Number of all proteins |
Number of amino acids |
Min. Seq. Length |
Max. Seq. Length |
Avg. Seq. Length |
Avg. Mol. Weight |
|---|---|---|---|---|---|---|---|
0 |
1928 |
89 |
784 |
385.6 |
43.65 |
Amino acid frequency
Ala |
Cys |
Asp |
Glu |
Phe |
Gly |
His |
Ile |
Lys |
Leu |
|---|---|---|---|---|---|---|---|---|---|
5.135 ± 1.102 | 1.297 ± 0.52 |
6.795 ± 0.339 | 4.305 ± 0.637 |
7.417 ± 0.911 | 4.824 ± 0.916 |
1.815 ± 0.666 | 5.965 ± 0.613 |
4.824 ± 1.016 | 8.766 ± 0.624 |
Met |
Asn |
Gln |
Pro |
Arg |
Ser |
Thr |
Val |
Trp |
Tyr |
|---|---|---|---|---|---|---|---|---|---|
2.49 ± 0.408 | 6.587 ± 0.765 |
4.253 ± 0.878 | 2.645 ± 0.799 |
4.409 ± 0.51 | 12.033 ± 1.226 |
4.876 ± 0.502 | 5.913 ± 0.625 |
0.467 ± 0.083 | 5.187 ± 0.612 |
Most of the basic statistics you can see at this page can be downloaded from this CSV file
See this proteome in:

Proteome-pI is available under Creative Commons Attribution-NoDerivs license, for more details see here
| Reference: Kozlowski LP. Proteome-pI 2.0: Proteome Isoelectric Point Database Update. Nucleic Acids Res. 2021, doi: 10.1093/nar/gkab944 | Contact: Lukasz P. Kozlowski |