Faecalibacterium sp. CAG:1138
Taxonomy: cellular organisms; Bacteria; Terrabacteria group; Firmicutes; Clostridia; Eubacteriales; Oscillospiraceae; Faecalibacterium; environmental samples
Average proteome isoelectric point is 6.36
Get precalculated fractions of proteins
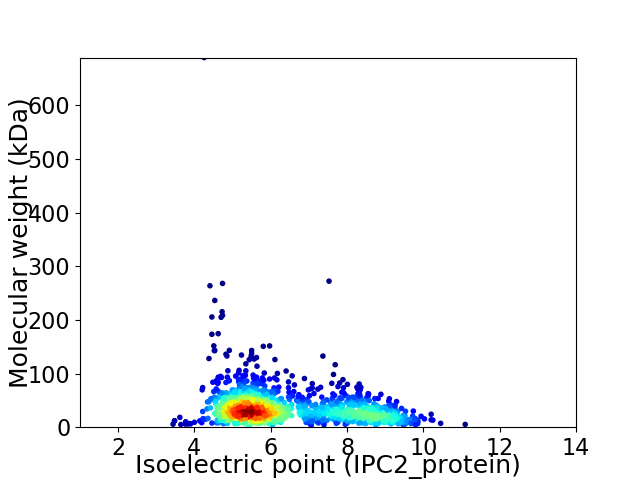
Virtual 2D-PAGE plot for 1284 proteins (isoelectric point calculated using IPC2_protein)
Get csv file with sequences according to given criteria:
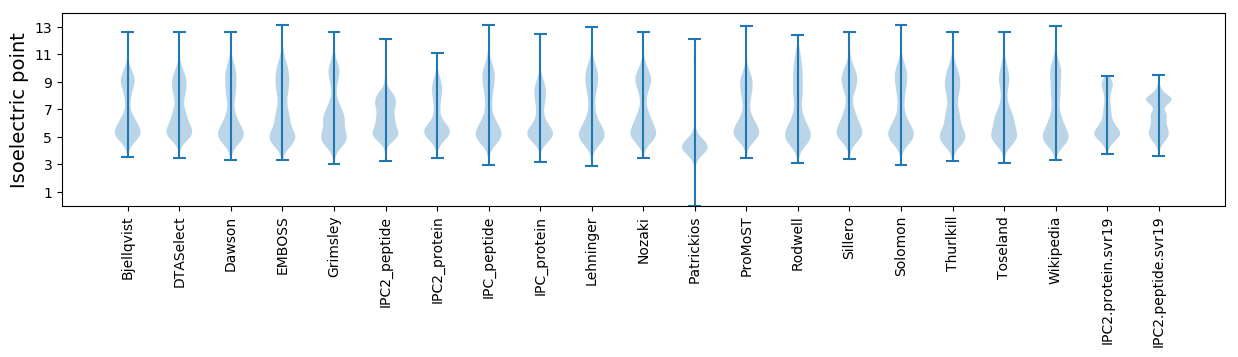
* You can choose from 21 different methods for calculating isoelectric point
Summary statistics related to proteome-wise predictions
Protein with the lowest isoelectric point:
>tr|R5FJG9|R5FJG9_9FIRM Abortive infection protein OS=Faecalibacterium sp. CAG:1138 OX=1262896 GN=BN468_00016 PE=4 SV=1
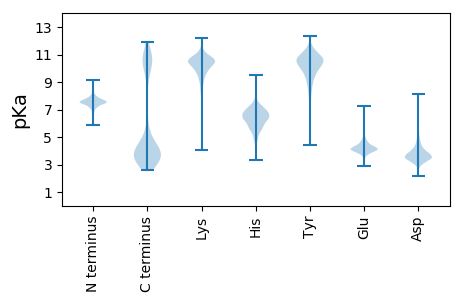
MM1 pKa = 8.01DD2 pKa = 5.13GVPTPGNAWGNPLFKK17 pKa = 11.18SPDD20 pKa = 3.03TDD22 pKa = 3.95ANDD25 pKa = 3.47WTTSADD31 pKa = 3.58FVIDD35 pKa = 3.41YY36 pKa = 9.8VRR38 pKa = 11.84HH39 pKa = 5.34YY40 pKa = 10.85RR41 pKa = 11.84LDD43 pKa = 4.08DD44 pKa = 3.45NTEE47 pKa = 3.84YY48 pKa = 10.77FYY50 pKa = 11.86GDD52 pKa = 3.02
MM1 pKa = 8.01DD2 pKa = 5.13GVPTPGNAWGNPLFKK17 pKa = 11.18SPDD20 pKa = 3.03TDD22 pKa = 3.95ANDD25 pKa = 3.47WTTSADD31 pKa = 3.58FVIDD35 pKa = 3.41YY36 pKa = 9.8VRR38 pKa = 11.84HH39 pKa = 5.34YY40 pKa = 10.85RR41 pKa = 11.84LDD43 pKa = 4.08DD44 pKa = 3.45NTEE47 pKa = 3.84YY48 pKa = 10.77FYY50 pKa = 11.86GDD52 pKa = 3.02
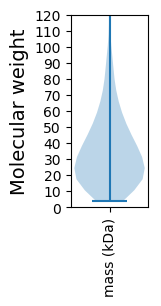
Molecular weight: 5.96 kDa
Isoelectric point according different methods:
Protein with the highest isoelectric point:
>tr|R5FFI1|R5FFI1_9FIRM Pseudouridine synthase OS=Faecalibacterium sp. CAG:1138 OX=1262896 GN=BN468_00270 PE=3 SV=1
MM1 pKa = 7.36KK2 pKa = 9.43RR3 pKa = 11.84TYY5 pKa = 9.67QPKK8 pKa = 9.11KK9 pKa = 7.52RR10 pKa = 11.84QRR12 pKa = 11.84SKK14 pKa = 9.07VHH16 pKa = 5.92GFRR19 pKa = 11.84KK20 pKa = 10.03RR21 pKa = 11.84MASASGRR28 pKa = 11.84KK29 pKa = 7.75VLKK32 pKa = 10.06RR33 pKa = 11.84RR34 pKa = 11.84RR35 pKa = 11.84AKK37 pKa = 10.53GRR39 pKa = 11.84AKK41 pKa = 10.69LSAA44 pKa = 3.92
MM1 pKa = 7.36KK2 pKa = 9.43RR3 pKa = 11.84TYY5 pKa = 9.67QPKK8 pKa = 9.11KK9 pKa = 7.52RR10 pKa = 11.84QRR12 pKa = 11.84SKK14 pKa = 9.07VHH16 pKa = 5.92GFRR19 pKa = 11.84KK20 pKa = 10.03RR21 pKa = 11.84MASASGRR28 pKa = 11.84KK29 pKa = 7.75VLKK32 pKa = 10.06RR33 pKa = 11.84RR34 pKa = 11.84RR35 pKa = 11.84AKK37 pKa = 10.53GRR39 pKa = 11.84AKK41 pKa = 10.69LSAA44 pKa = 3.92
Molecular weight: 5.2 kDa
Isoelectric point according different methods:
Peptides (in silico digests for buttom-up proteomics)
Below you can find in silico digests of the whole proteome with Trypsin, Chymotrypsin, Trypsin+LysC, LysN, ArgC proteases suitable for different mass spec machines.| Try ESI |
 |
|---|
| ChTry ESI |
|
|---|
| ArgC ESI |
|
|---|
| LysN ESI |
|
|---|
| TryLysC ESI |
|
|---|
| Try MALDI |
|
|---|
| ChTry MALDI |
|
|---|
| ArgC MALDI |
|
|---|
| LysN MALDI |
|
|---|
| TryLysC MALDI |
|
|---|
| Try LTQ |
|
|---|
| ChTry LTQ |
|
|---|
| ArgC LTQ |
|
|---|
| LysN LTQ |
|
|---|
| TryLysC LTQ |
|
|---|
| Try MSlow |
|
|---|
| ChTry MSlow |
|
|---|
| ArgC MSlow |
|
|---|
| LysN MSlow |
|
|---|
| TryLysC MSlow |
|
|---|
| Try MShigh |
|
|---|
| ChTry MShigh |
|
|---|
| ArgC MShigh |
|
|---|
| LysN MShigh |
|
|---|
| TryLysC MShigh |
|
|---|
General Statistics
Number of major isoforms |
Number of additional isoforms |
Number of all proteins |
Number of amino acids |
Min. Seq. Length |
Max. Seq. Length |
Avg. Seq. Length |
Avg. Mol. Weight |
|---|---|---|---|---|---|---|---|
0 |
443877 |
33 |
6396 |
345.7 |
38.31 |
Amino acid frequency
Ala |
Cys |
Asp |
Glu |
Phe |
Gly |
His |
Ile |
Lys |
Leu |
|---|---|---|---|---|---|---|---|---|---|
8.327 ± 0.071 | 1.358 ± 0.031 |
5.917 ± 0.059 | 7.083 ± 0.072 |
4.567 ± 0.049 | 7.427 ± 0.063 |
1.307 ± 0.03 | 6.27 ± 0.06 |
7.993 ± 0.062 | 8.757 ± 0.093 |
Met |
Asn |
Gln |
Pro |
Arg |
Ser |
Thr |
Val |
Trp |
Tyr |
|---|---|---|---|---|---|---|---|---|---|
2.427 ± 0.038 | 4.399 ± 0.042 |
3.23 ± 0.04 | 2.284 ± 0.031 |
3.913 ± 0.052 | 6.12 ± 0.054 |
5.595 ± 0.065 | 8.297 ± 0.07 |
0.755 ± 0.019 | 3.974 ± 0.051 |
Most of the basic statistics you can see at this page can be downloaded from this CSV file
See this proteome in:

Proteome-pI is available under Creative Commons Attribution-NoDerivs license, for more details see here
| Reference: Kozlowski LP. Proteome-pI 2.0: Proteome Isoelectric Point Database Update. Nucleic Acids Res. 2021, doi: 10.1093/nar/gkab944 | Contact: Lukasz P. Kozlowski |