Bacillus phage Harambe
Taxonomy: Viruses; Duplodnaviria; Heunggongvirae; Uroviricota; Caudoviricetes; Caudovirales; Salasmaviridae; Harambevirus; Bacillus virus Harambe
Average proteome isoelectric point is 6.13
Get precalculated fractions of proteins
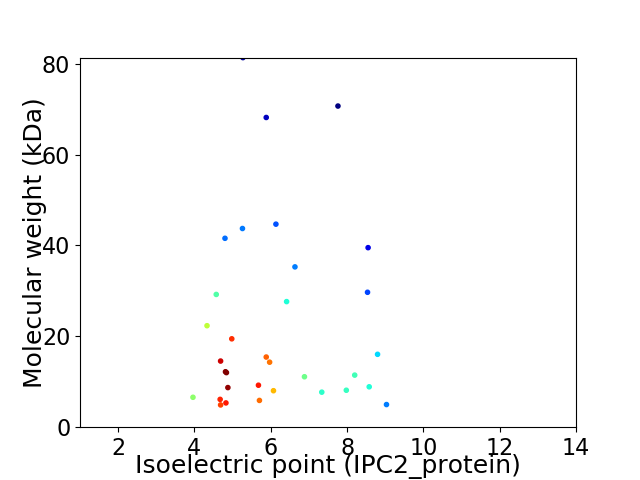
Virtual 2D-PAGE plot for 33 proteins (isoelectric point calculated using IPC2_protein)
Get csv file with sequences according to given criteria:
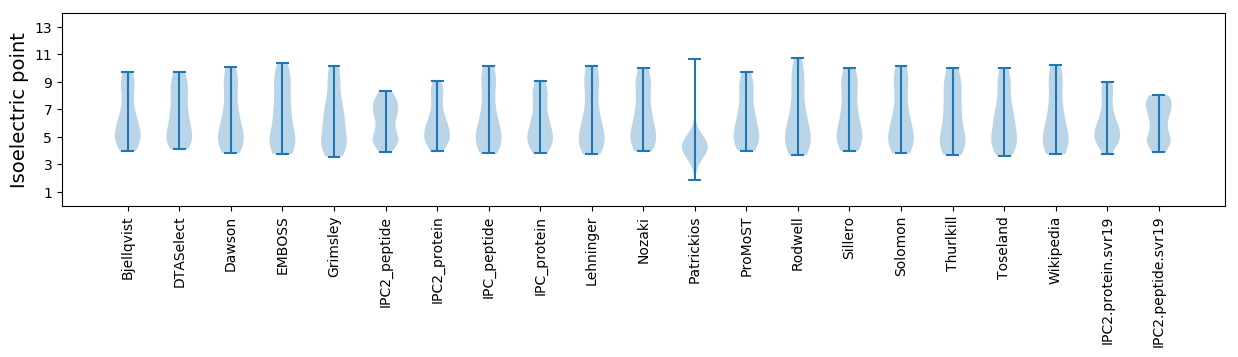
* You can choose from 21 different methods for calculating isoelectric point
Summary statistics related to proteome-wise predictions
Protein with the lowest isoelectric point:
>tr|A0A1W6JSB7|A0A1W6JSB7_9CAUD Tail knob protein OS=Bacillus phage Harambe OX=1981931 GN=HARAMBE_20 PE=4 SV=1
MM1 pKa = 7.62SEE3 pKa = 4.49RR4 pKa = 11.84FIDD7 pKa = 4.34SYY9 pKa = 9.52TLIYY13 pKa = 9.1ITEE16 pKa = 4.43DD17 pKa = 3.17EE18 pKa = 4.23SGKK21 pKa = 10.51RR22 pKa = 11.84FDD24 pKa = 6.23CILEE28 pKa = 4.1NQTQEE33 pKa = 4.01DD34 pKa = 4.52CEE36 pKa = 4.27IIYY39 pKa = 10.82GNIIDD44 pKa = 6.11KK45 pKa = 10.72IIVWNMILDD54 pKa = 3.69MM55 pKa = 5.45
MM1 pKa = 7.62SEE3 pKa = 4.49RR4 pKa = 11.84FIDD7 pKa = 4.34SYY9 pKa = 9.52TLIYY13 pKa = 9.1ITEE16 pKa = 4.43DD17 pKa = 3.17EE18 pKa = 4.23SGKK21 pKa = 10.51RR22 pKa = 11.84FDD24 pKa = 6.23CILEE28 pKa = 4.1NQTQEE33 pKa = 4.01DD34 pKa = 4.52CEE36 pKa = 4.27IIYY39 pKa = 10.82GNIIDD44 pKa = 6.11KK45 pKa = 10.72IIVWNMILDD54 pKa = 3.69MM55 pKa = 5.45
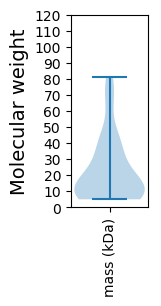
Molecular weight: 6.58 kDa
Isoelectric point according different methods:
Protein with the highest isoelectric point:
>tr|A0A1W6JSC9|A0A1W6JSC9_9CAUD Upper collar protein OS=Bacillus phage Harambe OX=1981931 GN=HARAMBE_21 PE=4 SV=1
MM1 pKa = 7.36NKK3 pKa = 9.77YY4 pKa = 9.84KK5 pKa = 10.75RR6 pKa = 11.84LAEE9 pKa = 4.54RR10 pKa = 11.84INVRR14 pKa = 11.84WNGSKK19 pKa = 10.71CSTGWAHH26 pKa = 7.43DD27 pKa = 4.23MIDD30 pKa = 4.33AITILMMKK38 pKa = 8.78EE39 pKa = 3.61QNKK42 pKa = 10.0
MM1 pKa = 7.36NKK3 pKa = 9.77YY4 pKa = 9.84KK5 pKa = 10.75RR6 pKa = 11.84LAEE9 pKa = 4.54RR10 pKa = 11.84INVRR14 pKa = 11.84WNGSKK19 pKa = 10.71CSTGWAHH26 pKa = 7.43DD27 pKa = 4.23MIDD30 pKa = 4.33AITILMMKK38 pKa = 8.78EE39 pKa = 3.61QNKK42 pKa = 10.0
Molecular weight: 4.98 kDa
Isoelectric point according different methods:
Peptides (in silico digests for buttom-up proteomics)
Below you can find in silico digests of the whole proteome with Trypsin, Chymotrypsin, Trypsin+LysC, LysN, ArgC proteases suitable for different mass spec machines.| Try ESI |
 |
|---|
| ChTry ESI |
|
|---|
| ArgC ESI |
|
|---|
| LysN ESI |
|
|---|
| TryLysC ESI |
|
|---|
| Try MALDI |
|
|---|
| ChTry MALDI |
|
|---|
| ArgC MALDI |
|
|---|
| LysN MALDI |
|
|---|
| TryLysC MALDI |
|
|---|
| Try LTQ |
|
|---|
| ChTry LTQ |
|
|---|
| ArgC LTQ |
|
|---|
| LysN LTQ |
|
|---|
| TryLysC LTQ |
|
|---|
| Try MSlow |
|
|---|
| ChTry MSlow |
|
|---|
| ArgC MSlow |
|
|---|
| LysN MSlow |
|
|---|
| TryLysC MSlow |
|
|---|
| Try MShigh |
|
|---|
| ChTry MShigh |
|
|---|
| ArgC MShigh |
|
|---|
| LysN MShigh |
|
|---|
| TryLysC MShigh |
|
|---|
General Statistics
Number of major isoforms |
Number of additional isoforms |
Number of all proteins |
Number of amino acids |
Min. Seq. Length |
Max. Seq. Length |
Avg. Seq. Length |
Avg. Mol. Weight |
|---|---|---|---|---|---|---|---|
0 |
6492 |
42 |
728 |
196.7 |
22.57 |
Amino acid frequency
Ala |
Cys |
Asp |
Glu |
Phe |
Gly |
His |
Ile |
Lys |
Leu |
|---|---|---|---|---|---|---|---|---|---|
4.96 ± 0.476 | 0.832 ± 0.191 |
6.346 ± 0.252 | 8.133 ± 0.665 |
4.375 ± 0.274 | 6.377 ± 0.519 |
1.848 ± 0.212 | 6.947 ± 0.392 |
8.641 ± 0.408 | 6.839 ± 0.336 |
Met |
Asn |
Gln |
Pro |
Arg |
Ser |
Thr |
Val |
Trp |
Tyr |
|---|---|---|---|---|---|---|---|---|---|
3.127 ± 0.255 | 6.778 ± 0.371 |
2.85 ± 0.253 | 3.62 ± 0.311 |
4.113 ± 0.298 | 5.314 ± 0.232 |
6.916 ± 0.496 | 6.146 ± 0.457 |
1.14 ± 0.14 | 4.698 ± 0.321 |
Most of the basic statistics you can see at this page can be downloaded from this CSV file
See this proteome in:

Proteome-pI is available under Creative Commons Attribution-NoDerivs license, for more details see here
| Reference: Kozlowski LP. Proteome-pI 2.0: Proteome Isoelectric Point Database Update. Nucleic Acids Res. 2021, doi: 10.1093/nar/gkab944 | Contact: Lukasz P. Kozlowski |