Rhizobium sp. AC44/96
Taxonomy: cellular organisms; Bacteria; Proteobacteria; Alphaproteobacteria; Hyphomicrobiales; Rhizobiaceae; Rhizobium/Agrobacterium group; Rhizobium; unclassified Rhizobium
Average proteome isoelectric point is 6.43
Get precalculated fractions of proteins
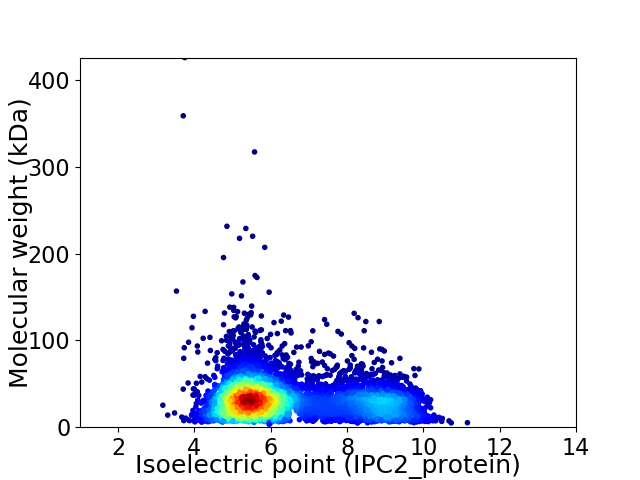
Virtual 2D-PAGE plot for 5685 proteins (isoelectric point calculated using IPC2_protein)
Get csv file with sequences according to given criteria:
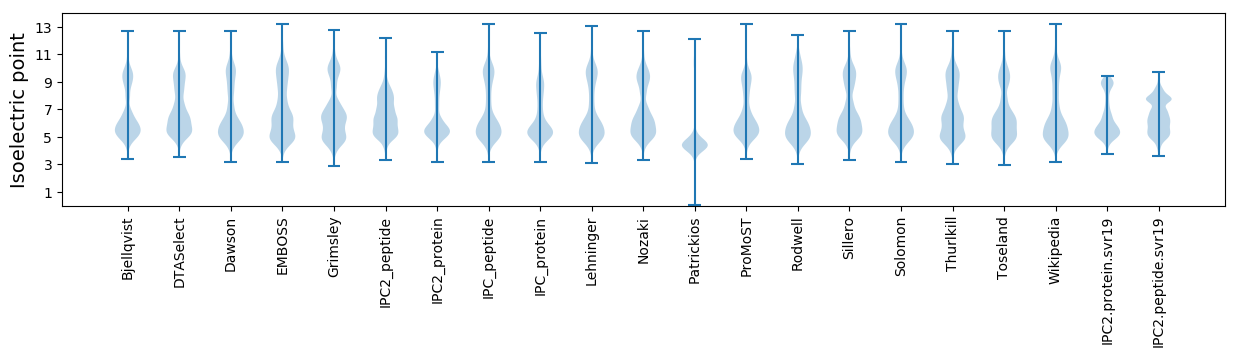
* You can choose from 21 different methods for calculating isoelectric point
Summary statistics related to proteome-wise predictions
Protein with the lowest isoelectric point:
>tr|A0A1B9SIG0|A0A1B9SIG0_9RHIZ Protein-glutamate methylesterase/protein-glutamine glutaminase OS=Rhizobium sp. AC44/96 OX=1841654 GN=cheB PE=3 SV=1
MM1 pKa = 7.17PQSILNAVGEE11 pKa = 4.28SLYY14 pKa = 11.09YY15 pKa = 10.62SGGSSAWFSATGSGPILNGTAGNDD39 pKa = 4.2SIWGDD44 pKa = 3.38SSVNVTMQGGTGDD57 pKa = 4.56DD58 pKa = 2.86IYY60 pKa = 11.71YY61 pKa = 10.19LYY63 pKa = 11.17SSINRR68 pKa = 11.84AVEE71 pKa = 3.86APGAGVDD78 pKa = 4.95TINTWMSYY86 pKa = 7.27TLPEE90 pKa = 4.06NFEE93 pKa = 4.33NLTVTGNGRR102 pKa = 11.84YY103 pKa = 9.82AFGNAADD110 pKa = 4.65NIISGASGSQTIDD123 pKa = 2.67GGAGNDD129 pKa = 3.49VLIGGGGADD138 pKa = 2.98TFIFTRR144 pKa = 11.84GNGSDD149 pKa = 4.56LIVDD153 pKa = 4.72FSSDD157 pKa = 3.18DD158 pKa = 3.82TIRR161 pKa = 11.84LDD163 pKa = 4.13GYY165 pKa = 11.09GLTSFDD171 pKa = 3.45QVLSHH176 pKa = 6.4STQEE180 pKa = 4.23GNNLRR185 pKa = 11.84LDD187 pKa = 3.84LGGGEE192 pKa = 4.46SLVLANHH199 pKa = 6.31TVADD203 pKa = 3.85LHH205 pKa = 7.07SDD207 pKa = 3.66QFQLTLDD214 pKa = 3.87RR215 pKa = 11.84SNLTLTFADD224 pKa = 4.17EE225 pKa = 4.44FDD227 pKa = 4.07SLSLRR232 pKa = 11.84NGDD235 pKa = 3.74QGTWDD240 pKa = 3.74AKK242 pKa = 10.44FWWAPDD248 pKa = 3.41KK249 pKa = 11.45GSTLPGNGEE258 pKa = 4.03QQWYY262 pKa = 9.82INPSYY267 pKa = 11.08AGTSAVNPFSVDD279 pKa = 3.12NGVLTITANKK289 pKa = 8.51TPAALEE295 pKa = 4.14SQIDD299 pKa = 4.45GYY301 pKa = 11.23DD302 pKa = 3.51YY303 pKa = 11.28TSGILTTHH311 pKa = 6.54SSFAQTYY318 pKa = 8.52GYY320 pKa = 10.77FEE322 pKa = 4.65IRR324 pKa = 11.84ADD326 pKa = 3.51MPTEE330 pKa = 3.84QGAWPAFWLLPEE342 pKa = 5.2DD343 pKa = 4.82GSWPPEE349 pKa = 3.78LDD351 pKa = 3.52VVEE354 pKa = 5.08MRR356 pKa = 11.84GQDD359 pKa = 3.42PKK361 pKa = 10.12TVNVTVHH368 pKa = 5.88SADD371 pKa = 3.39GGTHH375 pKa = 5.35VMEE378 pKa = 4.28STPVKK383 pKa = 10.02VASTEE388 pKa = 4.04GFHH391 pKa = 6.6TYY393 pKa = 9.81GVLWDD398 pKa = 3.65EE399 pKa = 4.83DD400 pKa = 3.88QIVWYY405 pKa = 10.0FDD407 pKa = 3.66DD408 pKa = 3.85VAVAHH413 pKa = 7.24ADD415 pKa = 3.88TPADD419 pKa = 3.52MHH421 pKa = 7.3DD422 pKa = 3.72PMYY425 pKa = 10.39MLVNLAIGGTAGTPTDD441 pKa = 3.75GLPNGSEE448 pKa = 3.7FHH450 pKa = 6.86IDD452 pKa = 3.47YY453 pKa = 10.66IHH455 pKa = 7.31AYY457 pKa = 9.62SLADD461 pKa = 3.63SPVTQATHH469 pKa = 6.92AATDD473 pKa = 3.31DD474 pKa = 3.59WQAA477 pKa = 3.04
MM1 pKa = 7.17PQSILNAVGEE11 pKa = 4.28SLYY14 pKa = 11.09YY15 pKa = 10.62SGGSSAWFSATGSGPILNGTAGNDD39 pKa = 4.2SIWGDD44 pKa = 3.38SSVNVTMQGGTGDD57 pKa = 4.56DD58 pKa = 2.86IYY60 pKa = 11.71YY61 pKa = 10.19LYY63 pKa = 11.17SSINRR68 pKa = 11.84AVEE71 pKa = 3.86APGAGVDD78 pKa = 4.95TINTWMSYY86 pKa = 7.27TLPEE90 pKa = 4.06NFEE93 pKa = 4.33NLTVTGNGRR102 pKa = 11.84YY103 pKa = 9.82AFGNAADD110 pKa = 4.65NIISGASGSQTIDD123 pKa = 2.67GGAGNDD129 pKa = 3.49VLIGGGGADD138 pKa = 2.98TFIFTRR144 pKa = 11.84GNGSDD149 pKa = 4.56LIVDD153 pKa = 4.72FSSDD157 pKa = 3.18DD158 pKa = 3.82TIRR161 pKa = 11.84LDD163 pKa = 4.13GYY165 pKa = 11.09GLTSFDD171 pKa = 3.45QVLSHH176 pKa = 6.4STQEE180 pKa = 4.23GNNLRR185 pKa = 11.84LDD187 pKa = 3.84LGGGEE192 pKa = 4.46SLVLANHH199 pKa = 6.31TVADD203 pKa = 3.85LHH205 pKa = 7.07SDD207 pKa = 3.66QFQLTLDD214 pKa = 3.87RR215 pKa = 11.84SNLTLTFADD224 pKa = 4.17EE225 pKa = 4.44FDD227 pKa = 4.07SLSLRR232 pKa = 11.84NGDD235 pKa = 3.74QGTWDD240 pKa = 3.74AKK242 pKa = 10.44FWWAPDD248 pKa = 3.41KK249 pKa = 11.45GSTLPGNGEE258 pKa = 4.03QQWYY262 pKa = 9.82INPSYY267 pKa = 11.08AGTSAVNPFSVDD279 pKa = 3.12NGVLTITANKK289 pKa = 8.51TPAALEE295 pKa = 4.14SQIDD299 pKa = 4.45GYY301 pKa = 11.23DD302 pKa = 3.51YY303 pKa = 11.28TSGILTTHH311 pKa = 6.54SSFAQTYY318 pKa = 8.52GYY320 pKa = 10.77FEE322 pKa = 4.65IRR324 pKa = 11.84ADD326 pKa = 3.51MPTEE330 pKa = 3.84QGAWPAFWLLPEE342 pKa = 5.2DD343 pKa = 4.82GSWPPEE349 pKa = 3.78LDD351 pKa = 3.52VVEE354 pKa = 5.08MRR356 pKa = 11.84GQDD359 pKa = 3.42PKK361 pKa = 10.12TVNVTVHH368 pKa = 5.88SADD371 pKa = 3.39GGTHH375 pKa = 5.35VMEE378 pKa = 4.28STPVKK383 pKa = 10.02VASTEE388 pKa = 4.04GFHH391 pKa = 6.6TYY393 pKa = 9.81GVLWDD398 pKa = 3.65EE399 pKa = 4.83DD400 pKa = 3.88QIVWYY405 pKa = 10.0FDD407 pKa = 3.66DD408 pKa = 3.85VAVAHH413 pKa = 7.24ADD415 pKa = 3.88TPADD419 pKa = 3.52MHH421 pKa = 7.3DD422 pKa = 3.72PMYY425 pKa = 10.39MLVNLAIGGTAGTPTDD441 pKa = 3.75GLPNGSEE448 pKa = 3.7FHH450 pKa = 6.86IDD452 pKa = 3.47YY453 pKa = 10.66IHH455 pKa = 7.31AYY457 pKa = 9.62SLADD461 pKa = 3.63SPVTQATHH469 pKa = 6.92AATDD473 pKa = 3.31DD474 pKa = 3.59WQAA477 pKa = 3.04
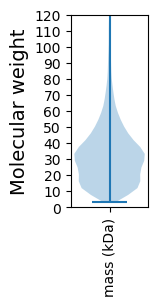
Molecular weight: 50.92 kDa
Isoelectric point according different methods:
Protein with the highest isoelectric point:
>tr|A0A1B9SMJ5|A0A1B9SMJ5_9RHIZ YCII domain-containing protein OS=Rhizobium sp. AC44/96 OX=1841654 GN=A6U87_00840 PE=3 SV=1
MM1 pKa = 7.35KK2 pKa = 9.43RR3 pKa = 11.84TYY5 pKa = 10.27QPSKK9 pKa = 9.73LVRR12 pKa = 11.84KK13 pKa = 9.15RR14 pKa = 11.84RR15 pKa = 11.84HH16 pKa = 4.42GFRR19 pKa = 11.84ARR21 pKa = 11.84MATKK25 pKa = 10.1GGRR28 pKa = 11.84KK29 pKa = 9.61VIVARR34 pKa = 11.84RR35 pKa = 11.84GRR37 pKa = 11.84GRR39 pKa = 11.84KK40 pKa = 9.08RR41 pKa = 11.84LSAA44 pKa = 4.03
MM1 pKa = 7.35KK2 pKa = 9.43RR3 pKa = 11.84TYY5 pKa = 10.27QPSKK9 pKa = 9.73LVRR12 pKa = 11.84KK13 pKa = 9.15RR14 pKa = 11.84RR15 pKa = 11.84HH16 pKa = 4.42GFRR19 pKa = 11.84ARR21 pKa = 11.84MATKK25 pKa = 10.1GGRR28 pKa = 11.84KK29 pKa = 9.61VIVARR34 pKa = 11.84RR35 pKa = 11.84GRR37 pKa = 11.84GRR39 pKa = 11.84KK40 pKa = 9.08RR41 pKa = 11.84LSAA44 pKa = 4.03
Molecular weight: 5.18 kDa
Isoelectric point according different methods:
Peptides (in silico digests for buttom-up proteomics)
Below you can find in silico digests of the whole proteome with Trypsin, Chymotrypsin, Trypsin+LysC, LysN, ArgC proteases suitable for different mass spec machines.| Try ESI |
 |
|---|
| ChTry ESI |
|
|---|
| ArgC ESI |
|
|---|
| LysN ESI |
|
|---|
| TryLysC ESI |
|
|---|
| Try MALDI |
|
|---|
| ChTry MALDI |
|
|---|
| ArgC MALDI |
|
|---|
| LysN MALDI |
|
|---|
| TryLysC MALDI |
|
|---|
| Try LTQ |
|
|---|
| ChTry LTQ |
|
|---|
| ArgC LTQ |
|
|---|
| LysN LTQ |
|
|---|
| TryLysC LTQ |
|
|---|
| Try MSlow |
|
|---|
| ChTry MSlow |
|
|---|
| ArgC MSlow |
|
|---|
| LysN MSlow |
|
|---|
| TryLysC MSlow |
|
|---|
| Try MShigh |
|
|---|
| ChTry MShigh |
|
|---|
| ArgC MShigh |
|
|---|
| LysN MShigh |
|
|---|
| TryLysC MShigh |
|
|---|
General Statistics
Number of major isoforms |
Number of additional isoforms |
Number of all proteins |
Number of amino acids |
Min. Seq. Length |
Max. Seq. Length |
Avg. Seq. Length |
Avg. Mol. Weight |
|---|---|---|---|---|---|---|---|
0 |
1779321 |
29 |
4176 |
313.0 |
34.03 |
Amino acid frequency
Ala |
Cys |
Asp |
Glu |
Phe |
Gly |
His |
Ile |
Lys |
Leu |
|---|---|---|---|---|---|---|---|---|---|
11.847 ± 0.042 | 0.794 ± 0.01 |
5.742 ± 0.034 | 5.601 ± 0.029 |
3.955 ± 0.024 | 8.246 ± 0.034 |
2.004 ± 0.015 | 5.767 ± 0.023 |
3.803 ± 0.028 | 9.878 ± 0.035 |
Met |
Asn |
Gln |
Pro |
Arg |
Ser |
Thr |
Val |
Trp |
Tyr |
|---|---|---|---|---|---|---|---|---|---|
2.55 ± 0.016 | 2.939 ± 0.02 |
4.775 ± 0.024 | 3.158 ± 0.019 |
6.422 ± 0.036 | 5.982 ± 0.027 |
5.454 ± 0.032 | 7.443 ± 0.025 |
1.279 ± 0.013 | 2.363 ± 0.018 |
Most of the basic statistics you can see at this page can be downloaded from this CSV file
See this proteome in:

Proteome-pI is available under Creative Commons Attribution-NoDerivs license, for more details see here
| Reference: Kozlowski LP. Proteome-pI 2.0: Proteome Isoelectric Point Database Update. Nucleic Acids Res. 2021, doi: 10.1093/nar/gkab944 | Contact: Lukasz P. Kozlowski |