Rhizobium sp. Root564
Taxonomy: cellular organisms; Bacteria; Proteobacteria; Alphaproteobacteria; Hyphomicrobiales; Rhizobiaceae; Rhizobium/Agrobacterium group; Rhizobium; unclassified Rhizobium
Average proteome isoelectric point is 6.45
Get precalculated fractions of proteins
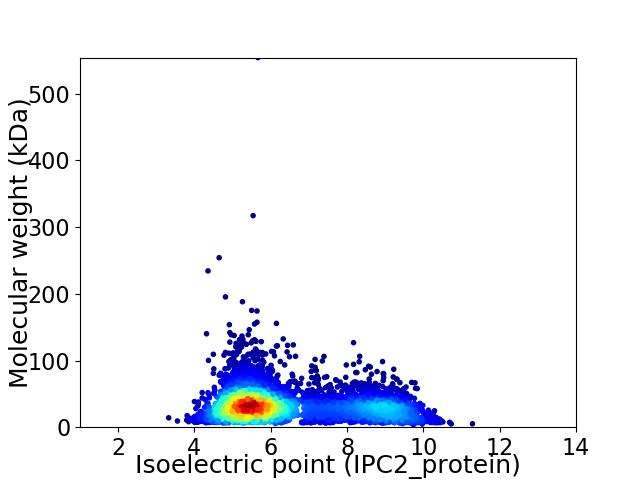
Virtual 2D-PAGE plot for 4726 proteins (isoelectric point calculated using IPC2_protein)
Get csv file with sequences according to given criteria:
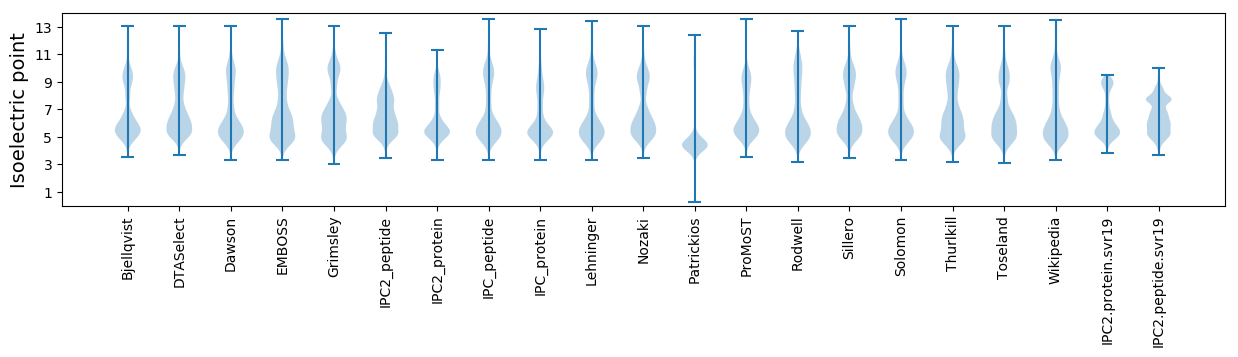
* You can choose from 21 different methods for calculating isoelectric point
Summary statistics related to proteome-wise predictions
Protein with the lowest isoelectric point:
>tr|A0A0Q8AQN9|A0A0Q8AQN9_9RHIZ Integrase OS=Rhizobium sp. Root564 OX=1736563 GN=ASD74_20800 PE=4 SV=1
MM1 pKa = 7.95CSTTLLGADD10 pKa = 3.61TTFGGIGLASYY21 pKa = 8.56PNPDD25 pKa = 3.28TFLPIASISPSGLWCTVIVPAVTEE49 pKa = 4.24TDD51 pKa = 3.22TSEE54 pKa = 4.18TPGIRR59 pKa = 11.84LTAVSILLAQDD70 pKa = 3.47AQSIPSTRR78 pKa = 11.84NLVCSSSLMASILLFF93 pKa = 4.17
MM1 pKa = 7.95CSTTLLGADD10 pKa = 3.61TTFGGIGLASYY21 pKa = 8.56PNPDD25 pKa = 3.28TFLPIASISPSGLWCTVIVPAVTEE49 pKa = 4.24TDD51 pKa = 3.22TSEE54 pKa = 4.18TPGIRR59 pKa = 11.84LTAVSILLAQDD70 pKa = 3.47AQSIPSTRR78 pKa = 11.84NLVCSSSLMASILLFF93 pKa = 4.17
Molecular weight: 9.59 kDa
Isoelectric point according different methods:
Protein with the highest isoelectric point:
>tr|A0A0Q8B9I6|A0A0Q8B9I6_9RHIZ Uncharacterized protein OS=Rhizobium sp. Root564 OX=1736563 GN=ASD74_19030 PE=4 SV=1
MM1 pKa = 7.69SKK3 pKa = 9.01RR4 pKa = 11.84TFQPSKK10 pKa = 9.84LVRR13 pKa = 11.84KK14 pKa = 9.15RR15 pKa = 11.84RR16 pKa = 11.84HH17 pKa = 4.42GFRR20 pKa = 11.84ARR22 pKa = 11.84MATAGGRR29 pKa = 11.84KK30 pKa = 8.88VLAARR35 pKa = 11.84RR36 pKa = 11.84ARR38 pKa = 11.84GRR40 pKa = 11.84ARR42 pKa = 11.84LSAA45 pKa = 3.99
MM1 pKa = 7.69SKK3 pKa = 9.01RR4 pKa = 11.84TFQPSKK10 pKa = 9.84LVRR13 pKa = 11.84KK14 pKa = 9.15RR15 pKa = 11.84RR16 pKa = 11.84HH17 pKa = 4.42GFRR20 pKa = 11.84ARR22 pKa = 11.84MATAGGRR29 pKa = 11.84KK30 pKa = 8.88VLAARR35 pKa = 11.84RR36 pKa = 11.84ARR38 pKa = 11.84GRR40 pKa = 11.84ARR42 pKa = 11.84LSAA45 pKa = 3.99
Molecular weight: 5.12 kDa
Isoelectric point according different methods:
Peptides (in silico digests for buttom-up proteomics)
Below you can find in silico digests of the whole proteome with Trypsin, Chymotrypsin, Trypsin+LysC, LysN, ArgC proteases suitable for different mass spec machines.| Try ESI |
 |
|---|
| ChTry ESI |
|
|---|
| ArgC ESI |
|
|---|
| LysN ESI |
|
|---|
| TryLysC ESI |
|
|---|
| Try MALDI |
|
|---|
| ChTry MALDI |
|
|---|
| ArgC MALDI |
|
|---|
| LysN MALDI |
|
|---|
| TryLysC MALDI |
|
|---|
| Try LTQ |
|
|---|
| ChTry LTQ |
|
|---|
| ArgC LTQ |
|
|---|
| LysN LTQ |
|
|---|
| TryLysC LTQ |
|
|---|
| Try MSlow |
|
|---|
| ChTry MSlow |
|
|---|
| ArgC MSlow |
|
|---|
| LysN MSlow |
|
|---|
| TryLysC MSlow |
|
|---|
| Try MShigh |
|
|---|
| ChTry MShigh |
|
|---|
| ArgC MShigh |
|
|---|
| LysN MShigh |
|
|---|
| TryLysC MShigh |
|
|---|
General Statistics
Number of major isoforms |
Number of additional isoforms |
Number of all proteins |
Number of amino acids |
Min. Seq. Length |
Max. Seq. Length |
Avg. Seq. Length |
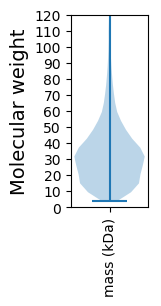
Avg. Mol. Weight |
|---|---|---|---|---|---|---|---|
0 |
1499049 |
34 |
5092 |
317.2 |
34.6 |
Amino acid frequency
Ala |
Cys |
Asp |
Glu |
Phe |
Gly |
His |
Ile |
Lys |
Leu |
|---|---|---|---|---|---|---|---|---|---|
11.391 ± 0.041 | 0.77 ± 0.012 |
5.717 ± 0.029 | 5.826 ± 0.037 |
3.958 ± 0.023 | 8.064 ± 0.032 |
2.002 ± 0.018 | 5.833 ± 0.028 |
4.079 ± 0.033 | 9.908 ± 0.044 |
Met |
Asn |
Gln |
Pro |
Arg |
Ser |
Thr |
Val |
Trp |
Tyr |
|---|---|---|---|---|---|---|---|---|---|
2.641 ± 0.015 | 2.981 ± 0.018 |
4.768 ± 0.03 | 3.266 ± 0.022 |
6.381 ± 0.034 | 6.07 ± 0.025 |
5.438 ± 0.026 | 7.321 ± 0.028 |
1.267 ± 0.015 | 2.319 ± 0.018 |
Most of the basic statistics you can see at this page can be downloaded from this CSV file
See this proteome in:

Proteome-pI is available under Creative Commons Attribution-NoDerivs license, for more details see here
| Reference: Kozlowski LP. Proteome-pI 2.0: Proteome Isoelectric Point Database Update. Nucleic Acids Res. 2021, doi: 10.1093/nar/gkab944 | Contact: Lukasz P. Kozlowski |