Methylophaga frappieri (strain ATCC BAA-2434 / DSM 25690 / JAM7)
Taxonomy: cellular organisms; Bacteria; Proteobacteria; Gammaproteobacteria; Thiotrichales; Piscirickettsiaceae; Methylophaga
Average proteome isoelectric point is 6.19
Get precalculated fractions of proteins
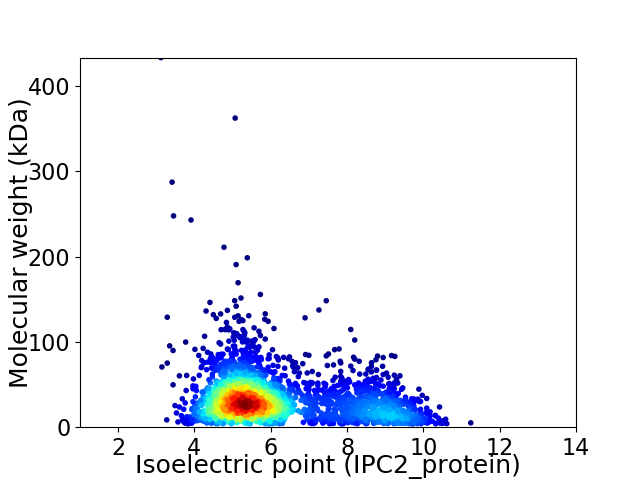
Virtual 2D-PAGE plot for 2689 proteins (isoelectric point calculated using IPC2_protein)
Get csv file with sequences according to given criteria:
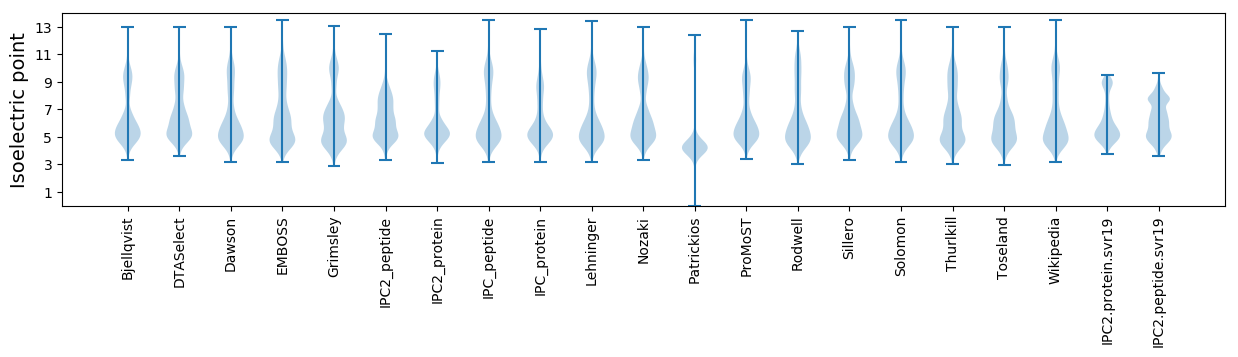
* You can choose from 21 different methods for calculating isoelectric point
Summary statistics related to proteome-wise predictions
Protein with the lowest isoelectric point:
>tr|I1YKN2|I1YKN2_METFJ Flagellar secretion chaperone FliS OS=Methylophaga frappieri (strain ATCC BAA-2434 / DSM 25690 / JAM7) OX=754477 GN=Q7C_2341 PE=3 SV=1
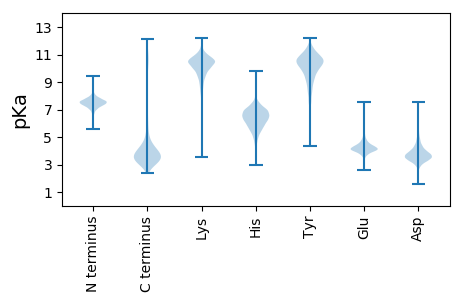
MM1 pKa = 7.21VATTEE6 pKa = 4.2DD7 pKa = 3.68YY8 pKa = 10.73RR9 pKa = 11.84LSVYY13 pKa = 10.4QGADD17 pKa = 3.24DD18 pKa = 3.78ARR20 pKa = 11.84YY21 pKa = 9.93SGVVKK26 pKa = 10.43IFAEE30 pKa = 5.21GIVGSGSLLYY40 pKa = 10.13GGQMILTAAHH50 pKa = 7.12LFDD53 pKa = 5.95ANPDD57 pKa = 3.68SVEE60 pKa = 3.84VRR62 pKa = 11.84FDD64 pKa = 3.55APFGSSTTISASLLTILPAYY84 pKa = 10.43DD85 pKa = 3.78SVSQNYY91 pKa = 9.37DD92 pKa = 3.03VALLTLAQPAPDD104 pKa = 3.43YY105 pKa = 11.09ARR107 pKa = 11.84RR108 pKa = 11.84YY109 pKa = 9.69DD110 pKa = 4.07LYY112 pKa = 10.14RR113 pKa = 11.84QRR115 pKa = 11.84DD116 pKa = 3.73EE117 pKa = 3.88LHH119 pKa = 6.04QVFDD123 pKa = 3.78LVGYY127 pKa = 8.27GRR129 pKa = 11.84PGAGAEE135 pKa = 4.35GVTSEE140 pKa = 4.61VPTSAEE146 pKa = 3.4RR147 pKa = 11.84LVAQNRR153 pKa = 11.84FDD155 pKa = 4.01TDD157 pKa = 3.04VGTLDD162 pKa = 5.61LFTFDD167 pKa = 3.36QMSWGPVAGTQLVADD182 pKa = 4.81FDD184 pKa = 4.82DD185 pKa = 5.57GSVALDD191 pKa = 3.41SLGQLMGVNDD201 pKa = 4.82LGQNLLEE208 pKa = 4.28GLITPGDD215 pKa = 3.66SGGPAFIDD223 pKa = 3.92GQVAGVASYY232 pKa = 10.49IARR235 pKa = 11.84FAQGDD240 pKa = 3.68QYY242 pKa = 11.81LDD244 pKa = 3.45TNEE247 pKa = 4.91TIDD250 pKa = 3.75SSFGEE255 pKa = 3.9LAFWQRR261 pKa = 11.84VSSYY265 pKa = 7.07TQWIDD270 pKa = 3.24TQIQQTYY277 pKa = 9.18PDD279 pKa = 4.38APQHH283 pKa = 5.82PEE285 pKa = 3.8EE286 pKa = 4.6VVTAVLEE293 pKa = 4.23GDD295 pKa = 3.54PGSVQRR301 pKa = 11.84AYY303 pKa = 10.94FLLQFTGVVAPGEE316 pKa = 4.57SVSVAYY322 pKa = 7.43QTRR325 pKa = 11.84DD326 pKa = 3.06GTALAGEE333 pKa = 4.92DD334 pKa = 4.09YY335 pKa = 10.88IAVAGRR341 pKa = 11.84AVIYY345 pKa = 10.01GSQQQTVIAVEE356 pKa = 4.51LIEE359 pKa = 5.66DD360 pKa = 3.6VTAEE364 pKa = 4.24SNEE367 pKa = 4.11HH368 pKa = 5.57FWLDD372 pKa = 3.03ISDD375 pKa = 4.0PQGGVLPGGASVISAQRR392 pKa = 11.84LILDD396 pKa = 4.59DD397 pKa = 4.66DD398 pKa = 3.85QLIAA402 pKa = 5.14
MM1 pKa = 7.21VATTEE6 pKa = 4.2DD7 pKa = 3.68YY8 pKa = 10.73RR9 pKa = 11.84LSVYY13 pKa = 10.4QGADD17 pKa = 3.24DD18 pKa = 3.78ARR20 pKa = 11.84YY21 pKa = 9.93SGVVKK26 pKa = 10.43IFAEE30 pKa = 5.21GIVGSGSLLYY40 pKa = 10.13GGQMILTAAHH50 pKa = 7.12LFDD53 pKa = 5.95ANPDD57 pKa = 3.68SVEE60 pKa = 3.84VRR62 pKa = 11.84FDD64 pKa = 3.55APFGSSTTISASLLTILPAYY84 pKa = 10.43DD85 pKa = 3.78SVSQNYY91 pKa = 9.37DD92 pKa = 3.03VALLTLAQPAPDD104 pKa = 3.43YY105 pKa = 11.09ARR107 pKa = 11.84RR108 pKa = 11.84YY109 pKa = 9.69DD110 pKa = 4.07LYY112 pKa = 10.14RR113 pKa = 11.84QRR115 pKa = 11.84DD116 pKa = 3.73EE117 pKa = 3.88LHH119 pKa = 6.04QVFDD123 pKa = 3.78LVGYY127 pKa = 8.27GRR129 pKa = 11.84PGAGAEE135 pKa = 4.35GVTSEE140 pKa = 4.61VPTSAEE146 pKa = 3.4RR147 pKa = 11.84LVAQNRR153 pKa = 11.84FDD155 pKa = 4.01TDD157 pKa = 3.04VGTLDD162 pKa = 5.61LFTFDD167 pKa = 3.36QMSWGPVAGTQLVADD182 pKa = 4.81FDD184 pKa = 4.82DD185 pKa = 5.57GSVALDD191 pKa = 3.41SLGQLMGVNDD201 pKa = 4.82LGQNLLEE208 pKa = 4.28GLITPGDD215 pKa = 3.66SGGPAFIDD223 pKa = 3.92GQVAGVASYY232 pKa = 10.49IARR235 pKa = 11.84FAQGDD240 pKa = 3.68QYY242 pKa = 11.81LDD244 pKa = 3.45TNEE247 pKa = 4.91TIDD250 pKa = 3.75SSFGEE255 pKa = 3.9LAFWQRR261 pKa = 11.84VSSYY265 pKa = 7.07TQWIDD270 pKa = 3.24TQIQQTYY277 pKa = 9.18PDD279 pKa = 4.38APQHH283 pKa = 5.82PEE285 pKa = 3.8EE286 pKa = 4.6VVTAVLEE293 pKa = 4.23GDD295 pKa = 3.54PGSVQRR301 pKa = 11.84AYY303 pKa = 10.94FLLQFTGVVAPGEE316 pKa = 4.57SVSVAYY322 pKa = 7.43QTRR325 pKa = 11.84DD326 pKa = 3.06GTALAGEE333 pKa = 4.92DD334 pKa = 4.09YY335 pKa = 10.88IAVAGRR341 pKa = 11.84AVIYY345 pKa = 10.01GSQQQTVIAVEE356 pKa = 4.51LIEE359 pKa = 5.66DD360 pKa = 3.6VTAEE364 pKa = 4.24SNEE367 pKa = 4.11HH368 pKa = 5.57FWLDD372 pKa = 3.03ISDD375 pKa = 4.0PQGGVLPGGASVISAQRR392 pKa = 11.84LILDD396 pKa = 4.59DD397 pKa = 4.66DD398 pKa = 3.85QLIAA402 pKa = 5.14
Molecular weight: 43.04 kDa
Isoelectric point according different methods:
Protein with the highest isoelectric point:
>tr|I1YJA1|I1YJA1_METFJ Chromosomal replication initiator protein DnaA OS=Methylophaga frappieri (strain ATCC BAA-2434 / DSM 25690 / JAM7) OX=754477 GN=dnaA PE=3 SV=1
MM1 pKa = 7.45KK2 pKa = 9.61RR3 pKa = 11.84TFQPSNLKK11 pKa = 10.2RR12 pKa = 11.84KK13 pKa = 7.57RR14 pKa = 11.84THH16 pKa = 6.05GFRR19 pKa = 11.84ARR21 pKa = 11.84MKK23 pKa = 8.28TVGGRR28 pKa = 11.84RR29 pKa = 11.84VISARR34 pKa = 11.84RR35 pKa = 11.84AKK37 pKa = 10.31GRR39 pKa = 11.84ARR41 pKa = 11.84LSAA44 pKa = 3.91
MM1 pKa = 7.45KK2 pKa = 9.61RR3 pKa = 11.84TFQPSNLKK11 pKa = 10.2RR12 pKa = 11.84KK13 pKa = 7.57RR14 pKa = 11.84THH16 pKa = 6.05GFRR19 pKa = 11.84ARR21 pKa = 11.84MKK23 pKa = 8.28TVGGRR28 pKa = 11.84RR29 pKa = 11.84VISARR34 pKa = 11.84RR35 pKa = 11.84AKK37 pKa = 10.31GRR39 pKa = 11.84ARR41 pKa = 11.84LSAA44 pKa = 3.91
Molecular weight: 5.1 kDa
Isoelectric point according different methods:
Peptides (in silico digests for buttom-up proteomics)
Below you can find in silico digests of the whole proteome with Trypsin, Chymotrypsin, Trypsin+LysC, LysN, ArgC proteases suitable for different mass spec machines.| Try ESI |
 |
|---|
| ChTry ESI |
|
|---|
| ArgC ESI |
|
|---|
| LysN ESI |
|
|---|
| TryLysC ESI |
|
|---|
| Try MALDI |
|
|---|
| ChTry MALDI |
|
|---|
| ArgC MALDI |
|
|---|
| LysN MALDI |
|
|---|
| TryLysC MALDI |
|
|---|
| Try LTQ |
|
|---|
| ChTry LTQ |
|
|---|
| ArgC LTQ |
|
|---|
| LysN LTQ |
|
|---|
| TryLysC LTQ |
|
|---|
| Try MSlow |
|
|---|
| ChTry MSlow |
|
|---|
| ArgC MSlow |
|
|---|
| LysN MSlow |
|
|---|
| TryLysC MSlow |
|
|---|
| Try MShigh |
|
|---|
| ChTry MShigh |
|
|---|
| ArgC MShigh |
|
|---|
| LysN MShigh |
|
|---|
| TryLysC MShigh |
|
|---|
General Statistics
Number of major isoforms |
Number of additional isoforms |
Number of all proteins |
Number of amino acids |
Min. Seq. Length |
Max. Seq. Length |
Avg. Seq. Length |
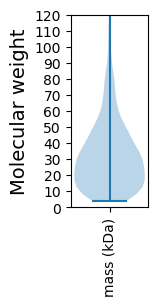
Avg. Mol. Weight |
|---|---|---|---|---|---|---|---|
0 |
835832 |
37 |
4182 |
310.8 |
34.45 |
Amino acid frequency
Ala |
Cys |
Asp |
Glu |
Phe |
Gly |
His |
Ile |
Lys |
Leu |
|---|---|---|---|---|---|---|---|---|---|
9.594 ± 0.058 | 0.9 ± 0.017 |
5.904 ± 0.048 | 5.813 ± 0.048 |
3.823 ± 0.033 | 6.925 ± 0.06 |
2.339 ± 0.026 | 6.037 ± 0.036 |
4.091 ± 0.045 | 10.745 ± 0.069 |
Met |
Asn |
Gln |
Pro |
Arg |
Ser |
Thr |
Val |
Trp |
Tyr |
|---|---|---|---|---|---|---|---|---|---|
2.539 ± 0.025 | 3.796 ± 0.034 |
4.296 ± 0.03 | 5.269 ± 0.049 |
5.501 ± 0.044 | 6.084 ± 0.042 |
5.538 ± 0.049 | 6.709 ± 0.043 |
1.329 ± 0.021 | 2.767 ± 0.027 |
Most of the basic statistics you can see at this page can be downloaded from this CSV file
See this proteome in:

Proteome-pI is available under Creative Commons Attribution-NoDerivs license, for more details see here
| Reference: Kozlowski LP. Proteome-pI 2.0: Proteome Isoelectric Point Database Update. Nucleic Acids Res. 2021, doi: 10.1093/nar/gkab944 | Contact: Lukasz P. Kozlowski |